Examining the Data
Now that you have your data in an EViews workfile, you may use basic EViews tools to examine the data in your series and groups in a variety of ways.
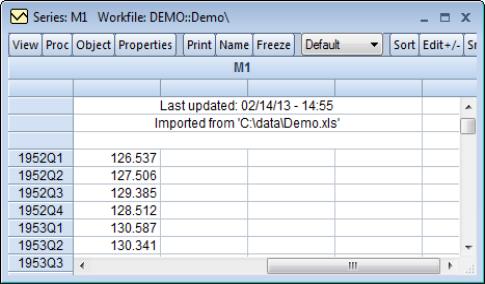
First, we examine the characteristics of individual series. To see the contents of the M1 series, simply double click on the M1 icon in the workfile window, or select in the main menu, enter m1, and click on OK.
EViews will open the M1 series object and will display the default spreadsheet view of the series. Note the description of the contents of the series (“Series: M1”) in the upper leftmost corner of the series window toolbar, indicating that you are working with the M1 series.
You will use the entries in the and menus to examine various characteristics of the series. Simply click on the buttons on the toolbar to access these menu entries, or equivalently, select or from the main menu.
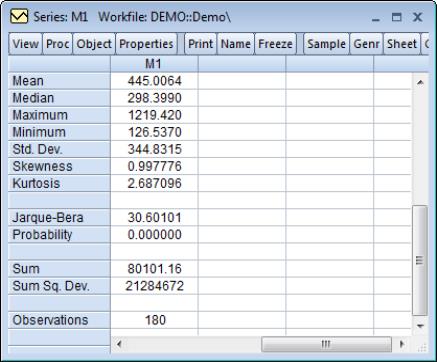
To compute, for example, a table of basic descriptive statistics for M1, simply click on the button, then select . EViews will compute descriptive statistics for M1 and change the series view to display a table of results.
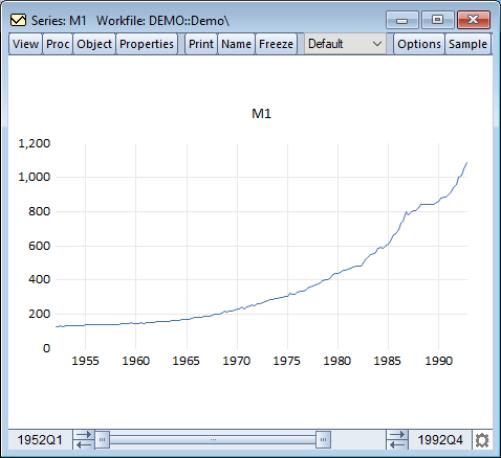
Similarly, to examine a line graph of the series, simply select to bring up the dialog, and select from the list of graph types on the left-hand side. EViews will change the M1 series window to display a line graph of the data in the M1 series.
Note the presence of the slider bar in the bottom of the window which you may drag to show a sub-sample of the observations.
At this point, you may wish to explore the contents of the and menus in the M1 series window to see the various tools for examining and working with series data. You may always return to the spreadsheet view of your series by selecting from the toolbar or main menu.
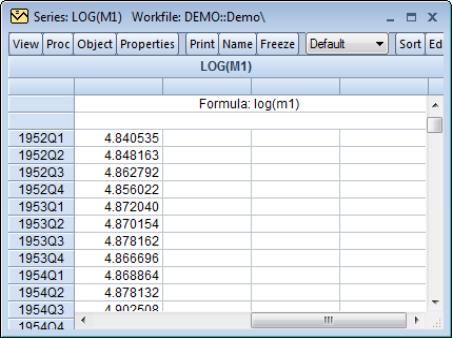
Since our ultimate goal is to perform regression analysis with our data expressed in natural logarithms, we may instead wish to work with the log of M1. Fortunately, EViews allows you to work with expressions involving series as easily as you work with the series themselves. To open a series containing this expression, select from the main menu, enter the text for the expression, log(m1), and click OK. EViews will open a series window for containing LOG(M1). Note that the titlebar for the series shows that we are working with the desired expression.
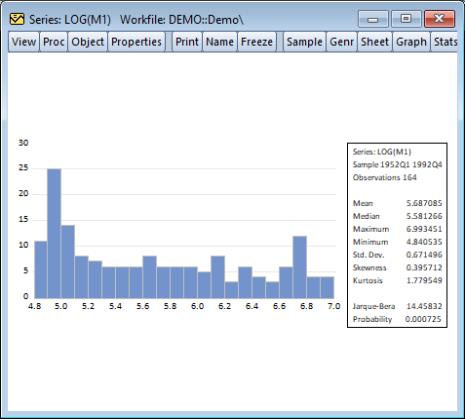
You may work with this auto-series in exactly the same way you worked with M1 above. For example, clicking on in the series toolbar and selecting displays a view containing a histogram and descriptive statistics for LOG(M1):
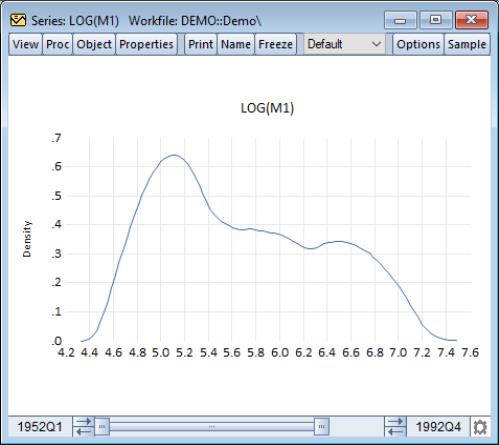
Alternately, we may display a smoothed version of the histogram by selecting , choosing Distribution from the list on the left and Kernel Density from the dropdown on the right, and clicking on OK to accept the default options:
Suppose that you wish to examine multiple series or series expressions. To do so, you will need to construct a group object that contains the series of interest.
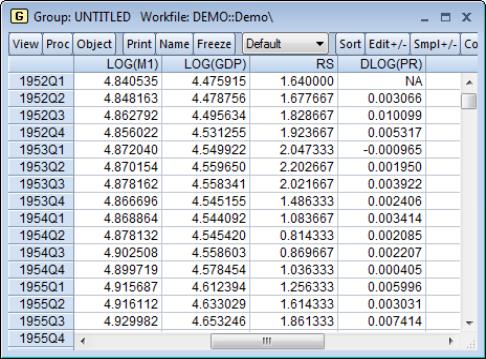
Earlier, you worked with an EViews created group object containing all of the series read from your Excel file. Here, we will construct a group object containing expressions involving a subset of those series. We wish to create a group object containing the logarithms of the series M1 and GDP, the level of RS, and the first difference of the logarithm of the series PR. Simply select from the main EViews menu, and enter the list of expressions and series names:
log(m1) log(gdp) rs dlog(pr)
Click on OK to accept the input. EViews will open a group window containing a spreadsheet view of the series and expressions of interest.
As with the series object, you will use the and menus of the group to examine various characteristics of the group of series. Simply click on the buttons on the toolbar to access these menu entries or select or from the main menu to call up the relevant entries. Note that the entries for a group object will differ from those for a series object since the kinds of operations you may perform with multiple series differ from the types of operations available when working with a single series.
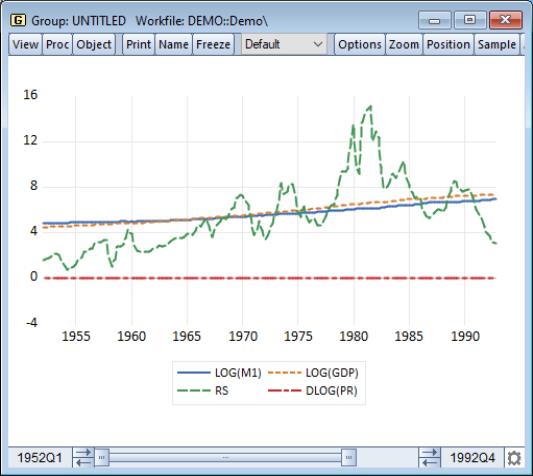
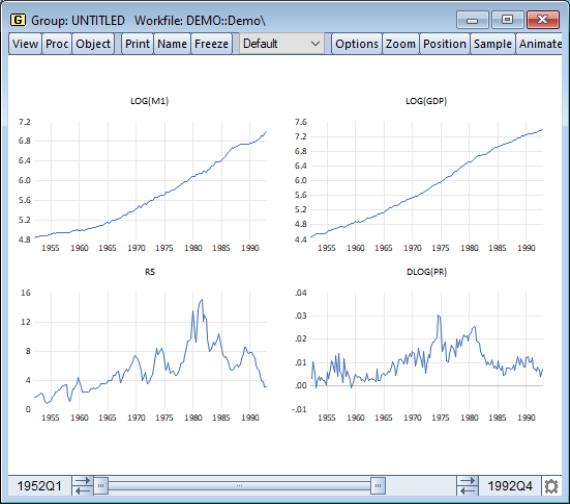
For example, you may select from the group object toolbar, and then select Line & Symbol from the list on the left side of the dialog to display a single graph containing line plots of each of the series in the group:
Alternately, you may select and choose from the Multiple series drop-down on the right side of the dialog to display the same information, but with each series or series expression plotted in an individual graph:
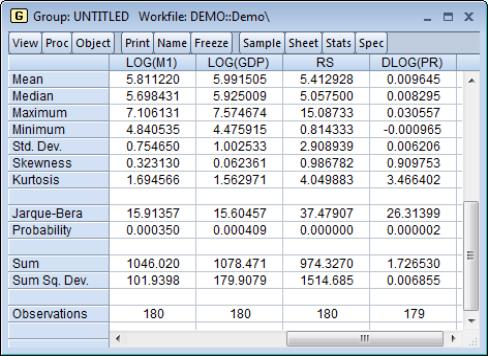
Likewise, you may select to display a table of descriptive statistics computed for each of the series in the group:
Note that the number of observations used for computing descriptive statistics for DLOG(PR) is one less than the number used to compute the statistics for the other expressions. By electing to compute our statistics using “Individual Samples”, we informed EViews that we wished to use the series specific samples in each computation, so that the loss of an observation in DLOG(PR) to differencing should not affect the samples used in calculations for the remaining expressions.
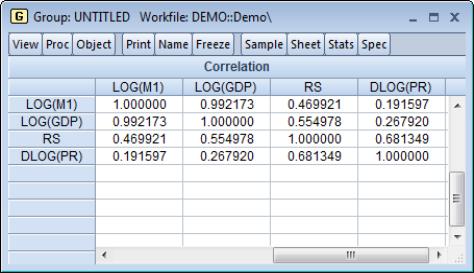
We may instead choose to use “Common Samples” so that observations are only used if the data are available for all of the series in the group. Click on and select only the Correlation checkbox to display the correlation matrix of the four series for the 179 common observations:
Once again, we suggest that you may wish to explore the contents of the and menus for this group to see the various tools for examining and working with sets of series You can always return to the spreadsheet view of the group by selecting .