Difference of the cumulative process of positive (above threshold) changes.
Compute the difference of the partial sum process of positive (above the threshold y) changes in the series x beginning in the specified date.
Syntax: @dcumdp(x, d[, y, s])
x: series
d: string
y: (optional) number
s: (optional) sample string or object
Return: series
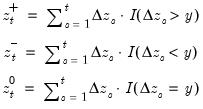
Consider the partial sum decomposition of a variable

given a initial value

as
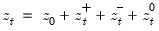
where

,

, and

are the partial sum processes of the differences for positive, negative, and zero
changes in

relative to the threshold
y:
The function returns the positive accumulation
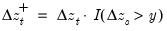
for the current or specified sample.
• The date
d string specification determines

.
• Values for dates prior to d will be NAs.
• The optional

argument specifies the threshold value. By default

.
This function is panel aware.
Examples
The code below produces a graph of @cumdp and @dcumdp applied on the sine wave x.
wfcreate u 50
series x = @sin(@pi*@trend/4)
group g @cumdp(x,1) @dcumdp(x,1)
g.line
Cross-references