Navigating the Geomap Display
You may use the scrollers on the right and button of image to view different portions of the image.
The scroller on the right allows you to see different portions of the current geomap display window.
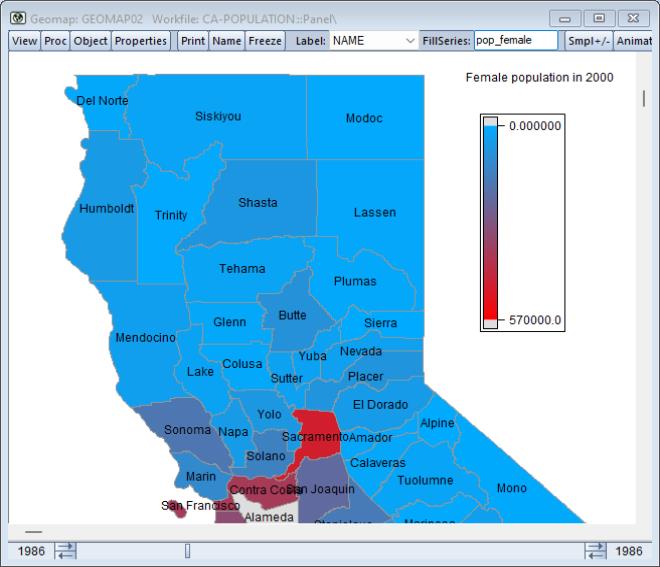
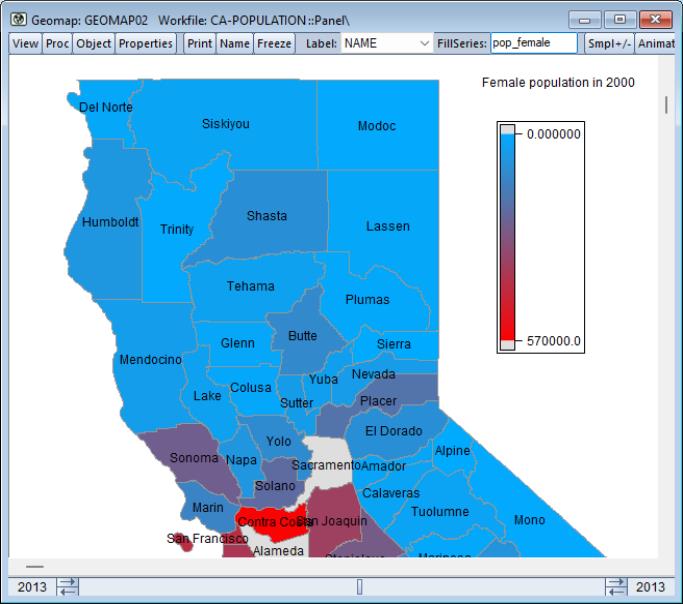
In panel workfile, a sample slider just below the horizontal scrollbar allows you to show the geomap at different time periods. Simply click on the arrows or drag the slider to show a different period.
Here we see the geomap display for the year 2013, which we may contrast with the map for 1986 above.
Switching to label drop-down from to changes the display to show the actual female population values: