Graph Pan and Zoom
Panning and zooming is available on graphs and graph views that feature the observation slider bar (i.e., those graph views that allow for subsample display). You may use these features to alter the display to focus on particular regions of the graph, much like cropping a photograph.
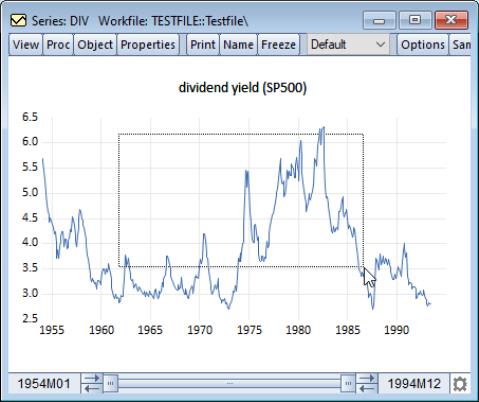
To zoom, left-click on the graph and drag the cursor to draw a box around the area into which you would like to zoom.
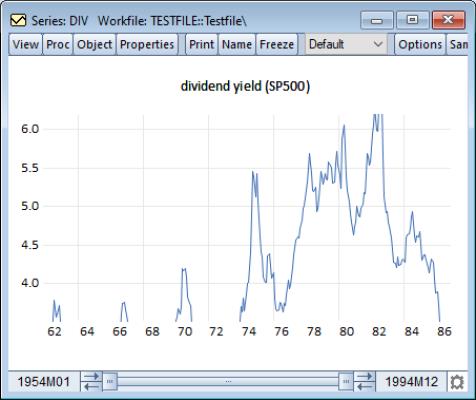
then release the mouse. The display changes to show only the area within the box and the observation slider bar and axis labels will change to reflect the modified display.
Note that there will be no indication that observations from the original graph have been trimmed away.
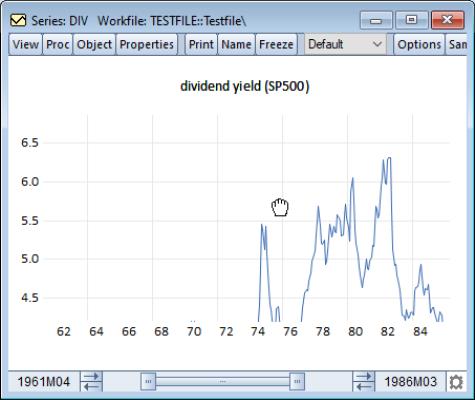
To pan, right-click on the graph, and when the cursor change to a hand, drag the image and release when the display shows the portion of the graph that is of interest.
Note that zooming and panning does not change the graph, only the visibility of the graph in the window. The observation slider bar and axis labels will change to reflect the modified display. Freezing the graph will take a snapshot of the current display.
To restore the original graph display, press ESC.


