Array Expressions
When editing a spreadsheet view of a series or group you may edit multiple cells of the spreadsheet at a time by using array expressions. To use an array expression, simply select the range of cells you wish to edit, then type the array expression you wish to use in the edit field at the top of the window, and hit return.
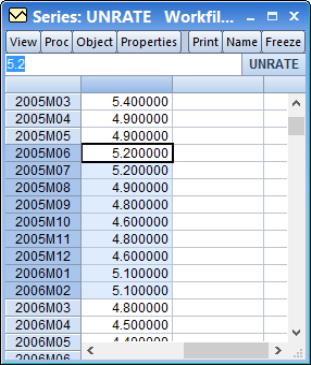
The simplest array expression is the “=” operator. This assigns the same value to each cell currently selected. In the example below, we select nine cells of the series UNRATE covering the period from June 2005 to February 2006.
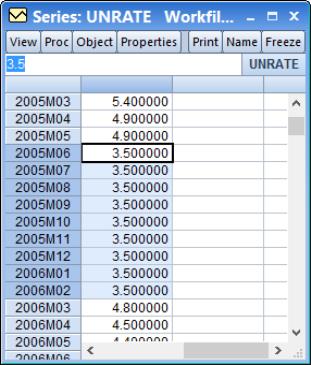
Type “=3.5” and hit return. All of the selected cells’ values change to be equal to 3.5:
Array expressions take one of two forms: operator/value adjustment and interpolation. Operator/value adjustment lets you specify an operation to apply to the existing data and specify values to use for that operation. Interpolation simply interpolates any missing values in the selected cells.
The full syntax for an array expression is either made up of the operator and values component:
[operator][values]
or a single interpolation component:
[interpolation]
Operators
The operator component defines how the new values will be assigned to the cells. The following table outlines the available operators.
| |
| Overwrites the existing value with the new value. |
| Adds the new value to the existing value. |
| Subtracts the new value from the existing value. |
| Multiplies the existing value by the new value. |
| Divides the existing value by the new value. |
| Overwrites the existing value with the previous cell’s value. |
| Add the new value to the previous cell’s value. |
| Subtract the new value from the previous cell’s value. |
| Multiply the previous cell’s value by the new value. |
| Divide the previous cell’s value by the new value. |
| Reverse the order of the selected cells. Note this operator does not require a values component. |
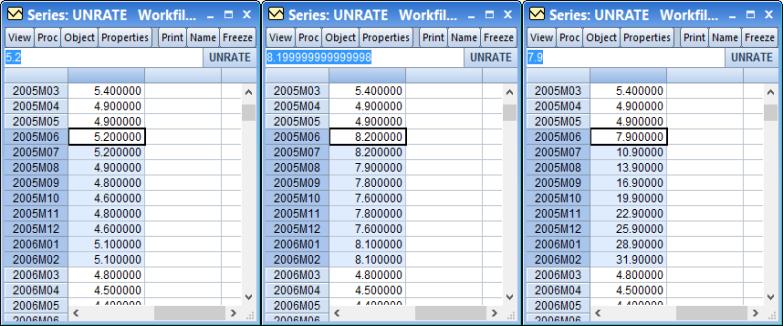
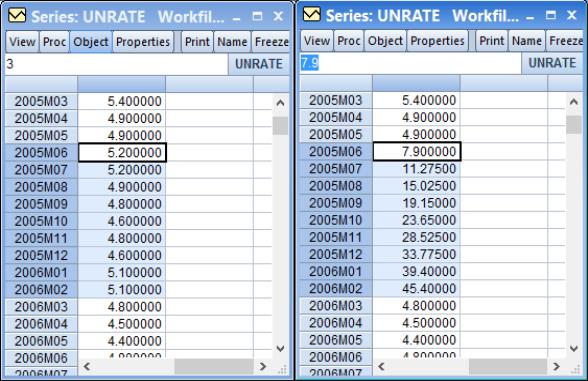
We have already seen an example of the simplest operator, the “=” which simply changes each cell to contain a new value. The following examples, using the same data as above, shows the impact of typing “+=3” as the array expression, and “+_3” as the expression:
The first pane shows the original data. The middle pane shows the impact of “+=3”, where each value in the selected region is equal to the original data plus 3.
The final pane shows the impact of entering “+_3” on the original data. Each value in the selected region is now equal to the previous cell’s value plus 3. The calculation is done recursively; only the first cell’s calculation uses the existing data. In the example shown in the final pane, the value of the first selected cell (7.9 in 2005M06) is equal to the previous value (4.9 in 2005M05) plus 3. The value in the second cell is equal to the new value in the first cell, 7.9, plus 3.
You should note that the two examples above were not done recursively. We performed the second example on the original data, not the data that had been already changed by the first example. EViews does not remember the “original” state of the data in the spreadsheet; once you use an array expression to change the data, that change is permanent and all subsequent modifications will be made using the new data.
Values
The simplest form of a value is a single number, such as the “3.5” or the “3” used in the examples above. When a single number is used, each cell in the selected range uses the same number. In the “+=3” example above, each cell had 3 added to its existing value.
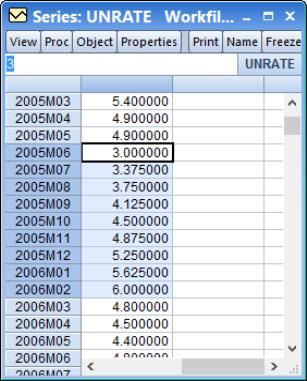
If you do not wish to use a single value for all cells, you may also specify a start point and an end point, separated by a “..” and let EViews fill in the values in between. For example, if you want the first cell in your selection to be the value “3”, and the last cell to be the value “6”, you would enter “3..6” as your values:
In this example we used the array expression “=3..6”. Since we used the “=” operator, we are overwriting the existing values with the new values. The first cell in the selection received a value of 3, and the last cell received 6. The cells in between were interpolated using simple linear interpolation.
When specifying a start and end point, you do not need to use the “=” operator; any of the operators can be used. In this example, we use the “+_3..6” expression:
The first pane shows the original data, and the second pane shows the effect of array expression. The value for the first cell is equal to the previous cell’s value, 4.9, plus 3. The value in the second cell is equal to that of the first cell, 7.9, plus the interpolated value of 3.375. The value of the third cell is equal to the value in the second cell, 11.275, plus the interpolated value of 3.75. This continues until the value in the last cell is equal to the value in the penultimate cell plus 6.
If you wish to interpolate between two existing data values, you do not need to type them in as the start point or end point. If you use a “..” without a value for the start point, EViews will simply use the value in the spreadsheet cell prior to the selection. If you do not provide an end point, EViews will use the value in the cell after the selection.
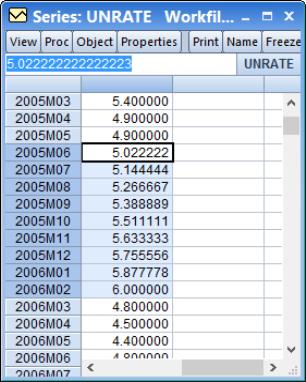
For example, using an array expression of “=..6” will interpolate between the value in 2005M05 (4.9) and 6, and enter the first interpolated value in the first selected cell, 2005M06:
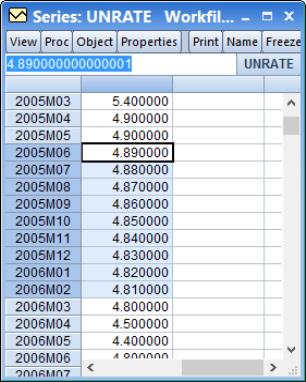
Since we entered an end point, the final cell in the selection, 2006M02, receives that end point value. If we use an array expression of “=..” without specifying a start or end point, EViews will interpolate between the value in 2005M05 and 2006M03 (the points before and after the selection), and the entire selection will be replaced with the interpolated values:
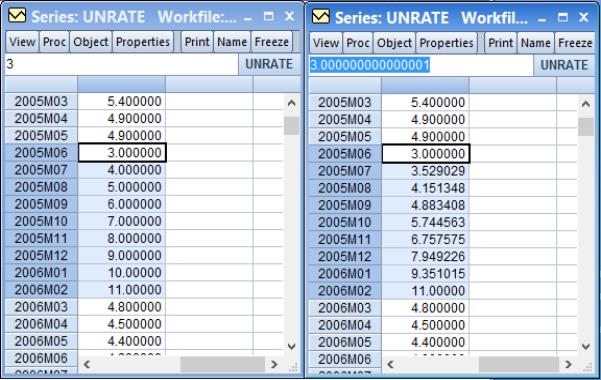
By default, any “..” values will be interpolated using simple linear interpolation. You may change this to perform multiplicative (log-linear) interpolation by appending an “*” to the end of your expression. This allows you to perform a geometric trend, rather than a linear trend to fill in the values. The following example shows the use of the expression “=3..11” and “=3..11*”:
Since we have 9 cells selected, and we specified the values 3 and 11, linear interpolation (the left pane) is straightforward to calculate: the increase in each cell is constant, and equal to (11-3)/(9-1) = 1. The right hand pane shows multiplicative interpolation. Here, the increase in the log of each cell value is constant, and is equal to (log(11)-log(3))/(9-1).
Interpolation
An interpolation array expression will interpolate any missing (NA) values in the selected range, and should not be used with either an operator or values component. There are a number of different interpolation techniques that can be used, each with its own symbol:
| |
| Repeats previous non-missing value. |
| Linear interpolation. |
| Cubic spline interpolation. |
| Catmull-Rom spline interpolation. |
| Log-linear (multiplicative) interpolation (linear in the log of the data). |
| Multiplicative cubic spline interpolation (a cubic spline on the log of the data). |
| Multiplicative Catmull-Rom spline interpolation (a Catmull-Rom spline on the log of the data). |
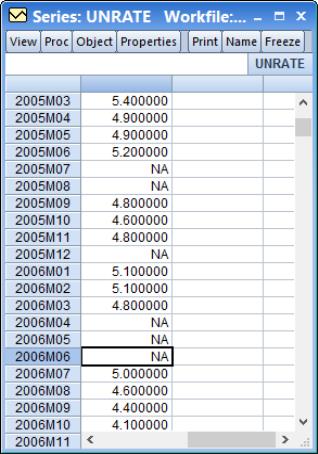
Take the following selection as an example:
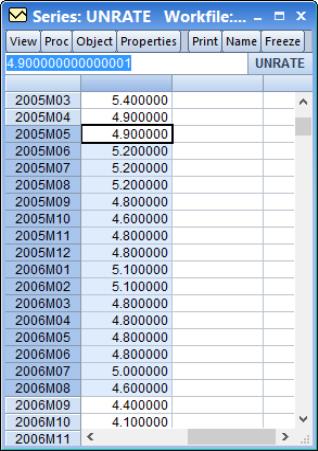
This selection contains a number of missing values. We first use the simple array expression “_” (we simply type “_” and then hit return) to interpolate the missing values with the previous available value:
The missing values in 2005M07 and 2005M08 are replaced by the previous available value, that for 2005M06, 5.20. Similarly, 2005M12 receives 2005M11’s value, and 2006M4, 2006M5 and 2006M6 all receive the value from 2006M3.
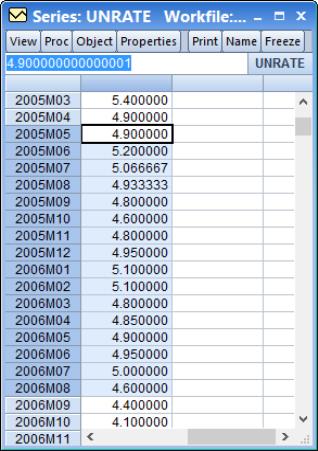
If we use the linear interpolation expression instead (“^”), we obtain different results:
Here, the value for 2005M7 is one third of the distance between the value for 2005M6 and 2005M9 (i.e. (1/3)*(4.8-5.2)+5.2), and the value for 2005M8 is two thirds of the distance between those two values. Similarly, the value for 2005M12 is half way between the value for 2005M11 and 2006M1.
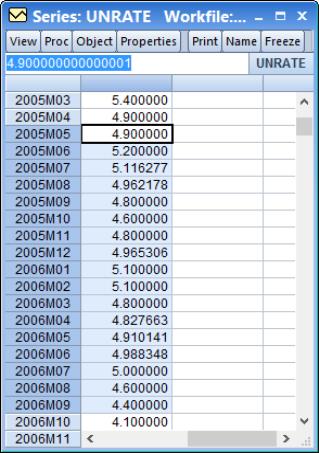
Using one of the spline interpolation methods allows for more curvature in the interpolated values. Here we use a multiplicative Catmull-Rom spline (“&*”):
