Example
We demonstrate the EViews implementation of BTVCVAR using a data set from Chan & Jeliazkov (2009). Open the EViews workfile “cj09.wf1” containing the series GDP (output growth), UNEMP (unemployment rate), INTEREST (interest rate), and INFLATION (inflation rate). Set the workfile sample to “1948Q4 2009Q4” to match the sample used by the code accompanying the paper.
Estimation
To estimate the BTVCVAR, run the following in the command window.
var myvar.btvcvar(nu1=7, nu2=6, size=20000, burn=1000, usemean) 1 1 gdp unemp interest inflation
in the command window. EViews will indicate the progress of the sampler in the bottom left corner of the window.
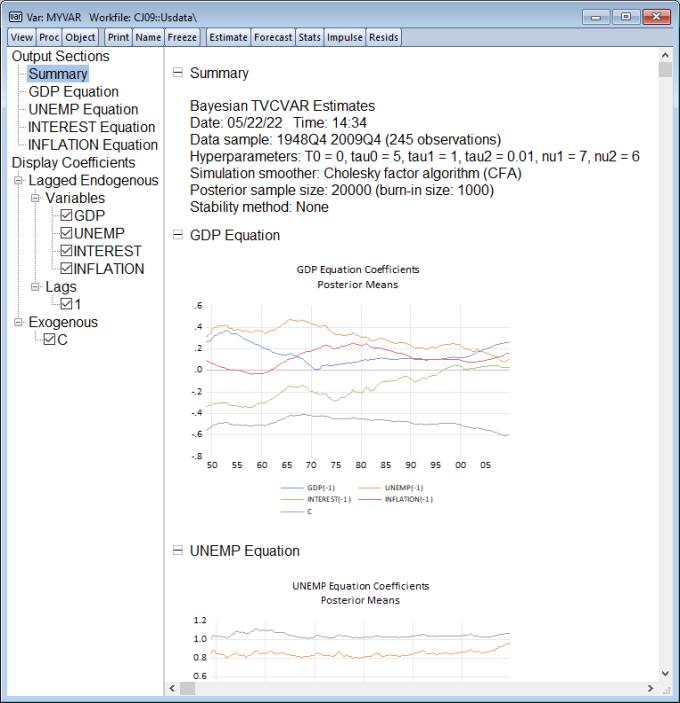
Once complete, double click on MYVAR to view the estimation output.
Estimation output for the BTVCVAR is presented as a spool object. A summary is provided at the top, followed by graphs showing the evolution of coefficients over time for each equation.
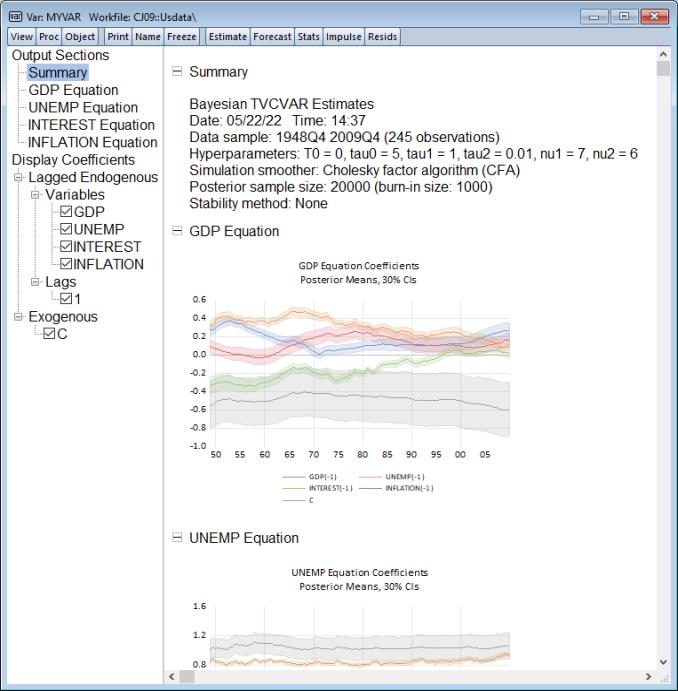
To change display options, click on the button in the VAR toolbar and go to the tab. As an example, to show shaded 30% credibility bands, check the box next to and enter 0.3 for . Click . The estimation output will update to look like this:
Note that changing display options will not prompt the posterior simulator to run if posterior draws are already available.
Impulse Response
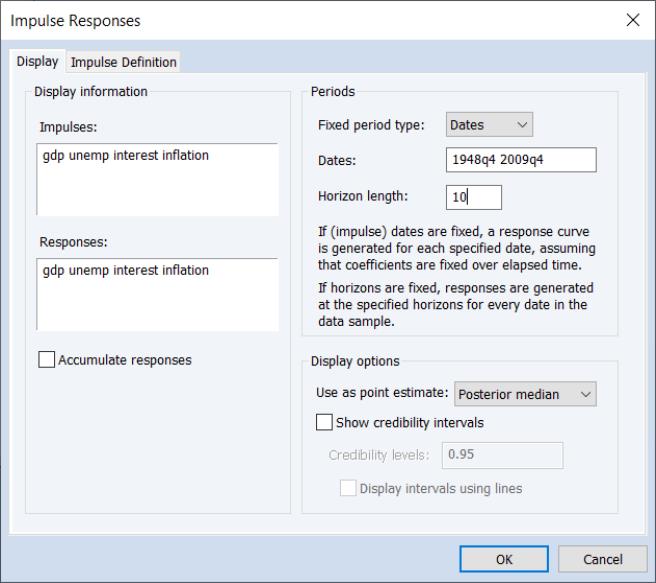
Once estimated, click on or click on the button on the toolbar to display the dialog:
Fill out the dialog as depicted by specifying in the dropdown menu, and enter “1948q4 2009q4” in the edit field. Click on to continue.
Alternately, you can enter
myvar.impulse(dates="1948q4 2009q4")
in the command line.
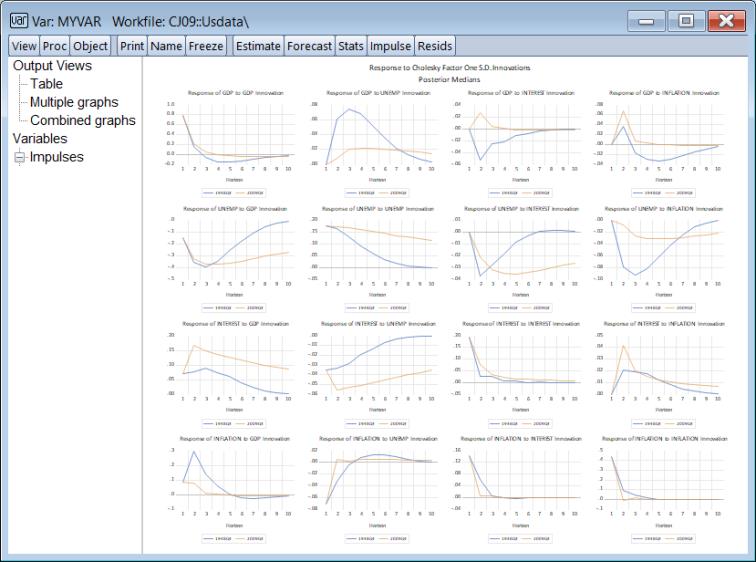
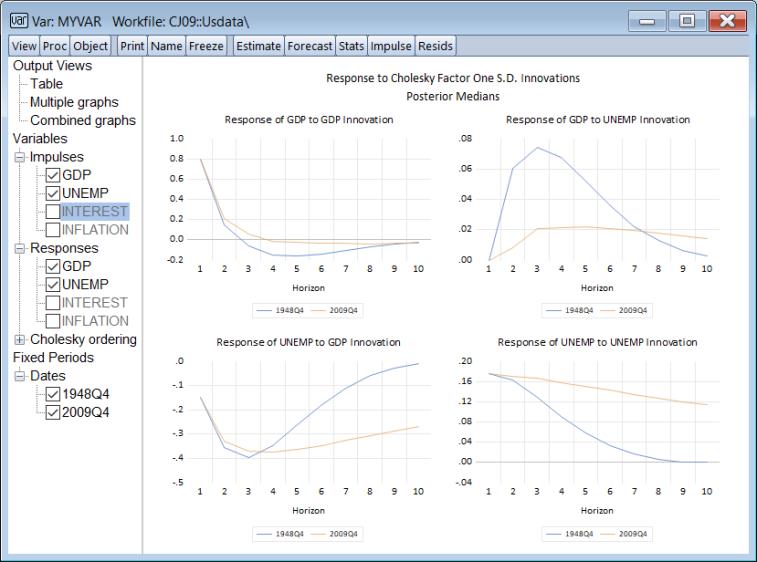
EViews will compute and display impulse responses for all of the variables using both the 1948Q2 and 2009Q4 posterior median coefficient values:
We may use the interactive panel on the left to customize the display. Click on the “+” icons next to Impulses and Responses to expand the impulse and response lists. Deselect INTEREST and INFLATION from both lists so that only results for GDP and UNEMP are shown:.
The graph on the top-left (titled “Response of GDP to GDP Innovation”) suggests that the way GDP reacts to its own shock is not significantly different between the start and end of the data sample, at least with the kind of shock and horizon length under consideration. In contrast, the response of GDP to UNEMP, UNEMP to GDP and UNEMP to UNEMP all differ significantly between 1948Q2 and 2009Q4.
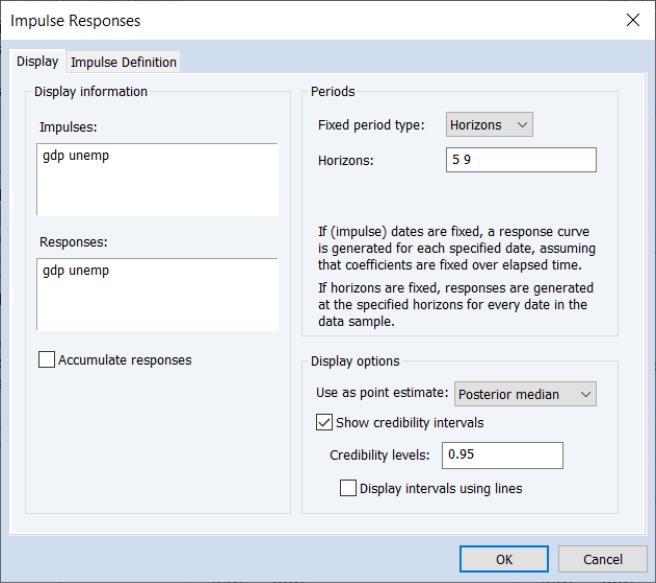
Next, we compute fixed horizon impulse responses. Click on the Impulse button to reopen the Impulse Responses dialog, select Horizons as the , enter “5 9” in the Horizons field, click on , and click on to continue:
Alternately, you can enter
myvar.impulse(se=bayes, horizons="5 9", showci) gdp unemp @imp gdp unemp
in the command line.
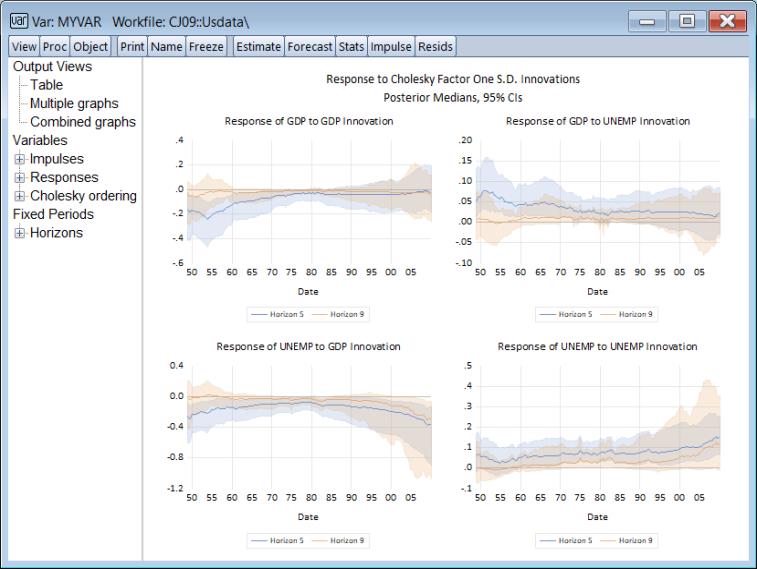
Note that the computation of the BTVCVAR IRs takes considerably longer since EViews is computing 245 impulse responses up to the maximum specified horizon, one for every date in the estimation sample.
Upon completion, EViews will display IRs at horizon lengths 5 and 9:
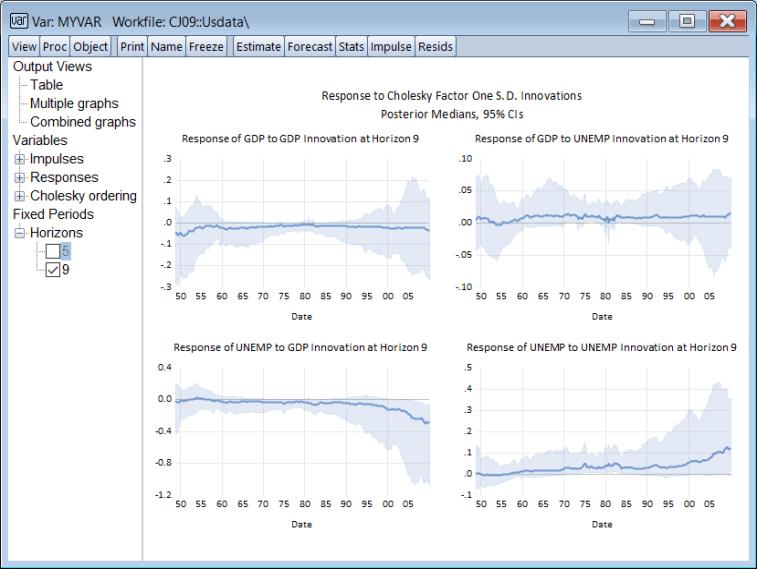
In the left panel, deselect “5” from the Horizons list, and click on in the to show only the medium-term 2 year responses are displayed in grouped graphs:
The bottom-left graph (titled “Response of UNEMP to GDP Innovation at Horizon 9”) suggests that the effect of a GDP shock on UNEMP wore off more quickly before the year 2000 than after that date, though the credibility bands are quite wide at the later dates.