Working with a BTCVAR
Procs
To get posterior draws from the BTVCVAR object (to generate trace plots, for example), click on . To generates inefficiency factors, click on . NAs are given if sample autocorrelation does not fall below 0.05 in the first 100 lags.
Other procs produce coefficient estimates, relative numerical efficiencies (RNEs), effective sample sizes (ESSs), and residuals.
Residuals
To view an estimate of the error matrix in the form of a graph, go to or click on the button in the VAR toolbar. Go to to see the same information in a table. Click on for an estimate of the observation covariance matrix.
Impulse Response
Background
The standard VAR impulse-response function (IRF) describes the effects of a shock to the system as a function of the elapsed time since a shock (see
“Impulse Response Analysis”). Since the coefficients of the VAR are constant, the timing of the shock does not matter and the system’s response to a shock occurring at one date is identical to its response to the same shock occurring at a different date.
In contrast, the TVCVAR IRF is a function of both the timing (date) of the shock and the elapsed time since the shock. Timing matters for a TVCVAR because the VAR coefficients are different at different dates, so that the system responds differently to a given stimulus.
Conceptually, the graph of the TVCVAR IRF is a response surface over two axes, one representing the date of a shock and another representing elapsed time. Although this response surface provides a complete picture of the dynamics of a TVCVAR system, typically one focuses on cross-sections of the surface, taken either by fixing the shock date, or by fixing elapsed time.
• A TVCVAR IRF at a fixed shock date is a standard VAR IRF generated using the TVCVAR coefficients at that date. This graph shows how a shock at the specified date passes through the system (assuming that the coefficients are fixed over the IRF horizon).
• A TVCVAR IRF at a fixed horizon shows how the system with a shock experienced at different dates produces responses at the specified time horizon (again assuming that the coefficients at a given date are fixed through the horizon). The fixed horizon cross-section IR is obtained from the ensemble of cross-section fixed date IRFs.
Impulse Response Dialog
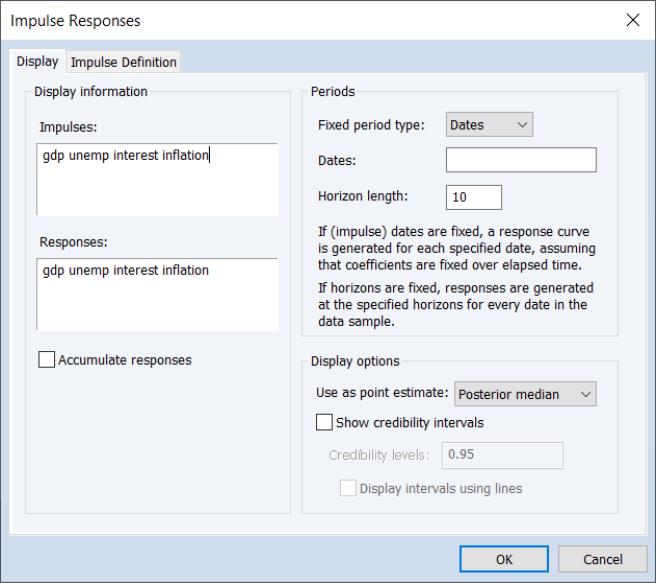
To generate BTVCVAR impulse responses via dialog, go to View/Impulse Response... or click on the Impulse button in the VAR toolbar. This will open the BTVCVAR version of the Impulse Responses dialog:
The dialog has two tabs: a tab where you will describe the default display settings, and an tab where you will describe how you wish the impulses to be constructed.
Display Settings
There are three sections in the Display tab.
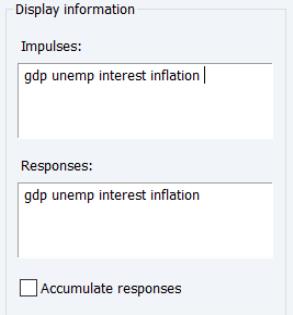
The Display information section is nearly identical to that for a standard VAR IRF. Here, you will specify the impulses and responses you wish to examine and determine whether to produce accumulated responses:
Note that the edit field has been moved out of this section to accommodate cross-section fixed horizon computation.
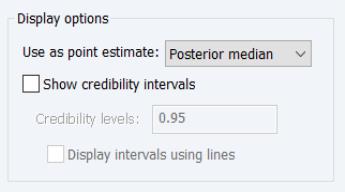
The Display options offer settings for which coefficient values to use when compute the impulse responses, whether to show credibility intervals in tables and graphs, and if so, how they should be computed and displayed in graphs:
• The drop down should be used to choose between using the or the values.
• The checkbox determines whether to show the intervals in tables and graphs. If you elect to show the intervals, you will be prompted to provide one or more values in the edit field, and will be shown a checkbox for whether to in graphs.
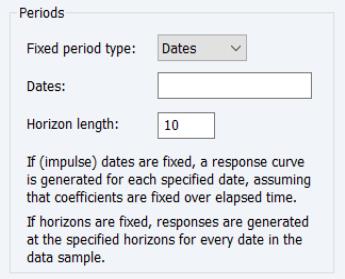
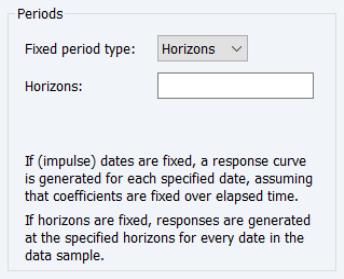
The section controls whether you will produce IRs that are for fixed periods (dates) or for fixed horizons, and at which values to perform the computation.
• If you set the dropdown to , EViews will prompt you to enter one or more as which to compute impulse responses, and the up to which those responses should be computed:
Only valid dates in the estimation sample are permitted.
• If you set the dropdown to , EViews will prompt you to enter one or more at which to compute the IRs:
The specified horizons must be positive integers. Note that IRs are computed for every date in the data sample.
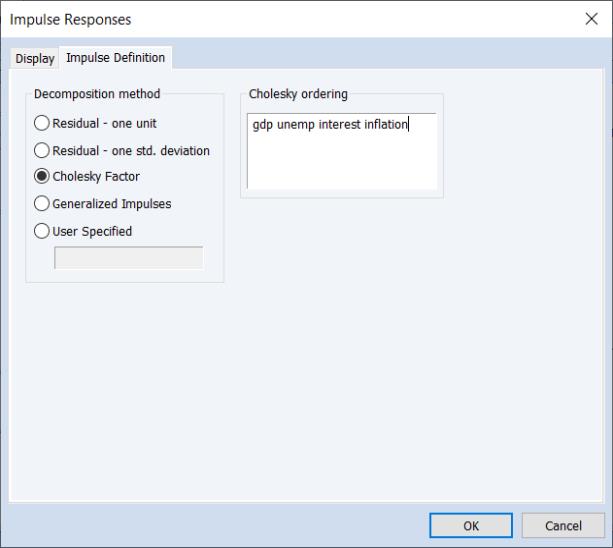
Impulse Definition Settings
The tab specifies the method used to produce impulses.
Forecasting
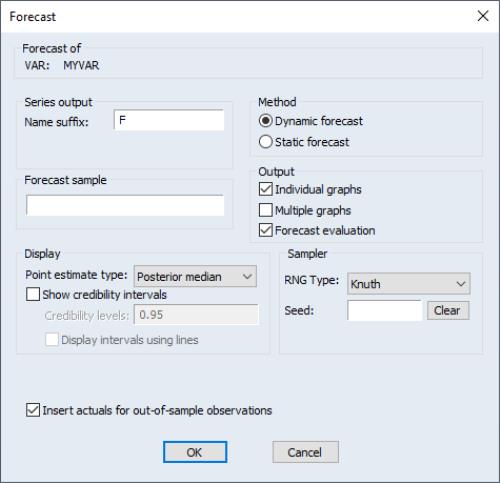
To generate forecasts, go to or click on the button in the VAR toolbar.
If Dynamic forecast is selected, forecasts are generated from a standard, time-invariant VAR with coefficients taken from the first date in the forecast sample. If the forecast sample starts after the data sample, then coefficients are taken from the last date in the data sample.
If Static forecast is selected, forecasts are generated from a time-varying VAR until the end of the data sample. Forecasts after the data sample are generated from a standard VAR with coefficients taken from the end of the data sample.
Forecast display options are identical to those used in estimation.