Geomaps
The EViews geomap object is capable of using Esri (
www.esri.com) shapefiles to draw geographic maps.
The shapefile format is a popular file format for storing and describing geographic information about a collection of shapes. Shapefiles are readily available from various sources on the internet. Some examples of shapefile sources include the United States Census (
www.census.gov) and ArcGIS (
https://hub.arcgis.com/).
Geomaps are useful for visualizing data that are tied to specific geographic regions. You can for example create a world geomap and using color-mapping feature to color the map shapes for country based on their GDP.
Overview
There are four steps in using a geomap in EViews:
• reading a shapefile containing shape drawing information and attribute values associated with each shape
• selecting one of the shapefile attributes to provide text labels for the shapes
• linking the shapes in the shapefile to observations in the workfile by specifying a series containing values that match the shapefile attribute values
• using a series to apply a colormap defining the shape fill colors
The first two steps are required to display labeled shapes.
The linking step is required to associate observations from your EViews workfile with the individual shapes.
The final step specifies values for each observation to define fill colors for each associated shape.
Creating and Configuring a Geomap
To create a geomap object in a workfile, you may select from the workfile menu, optionally enter a name in the edit field, and click on . Alternately, you may simply enter the declaration command geomap followed by an optional name in the command window, then press .
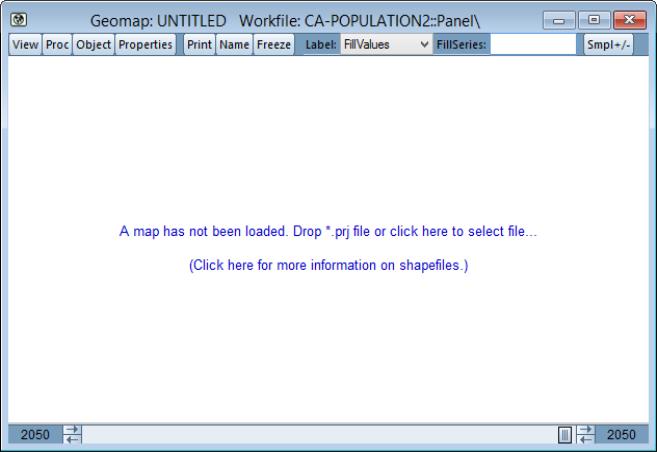
Loading a Shapefile
To load a shapefile simply drop a shapefile (“.prj”) file in the client area of the window, or click to open a file dialog and navigate to and open the file.
Linking Shapes to Observations
(If you do not need to use workfile data to fill in map shapes, you may skip the following step.)
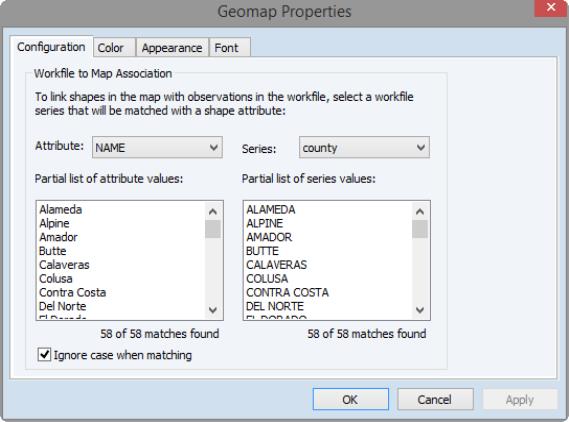
Once a shapefile has been loaded, you will be prompted to link the shapes in the shapefile with the observations in the workfile:
• First, you should select the shapefile attribute whose values you will link to data in the workfile.
• Next, you should use the right dropdown menu to select the series in the workfile that will be used to identify which observations in the workfile will be paired to a shape.
Matches between the values in the shapefile attributes and the values in the workfile series will be used for identification.
As you make your dropdown selections in the dropdown menus, EViews will show you a partial list of the unique attribute values from the shapefile or series. Below each box is a description identifying how many in each list will be paired. Note that there may be some shapes in the shapefile without a corresponding observation in the workfile and vice versa.
Click on to continue.
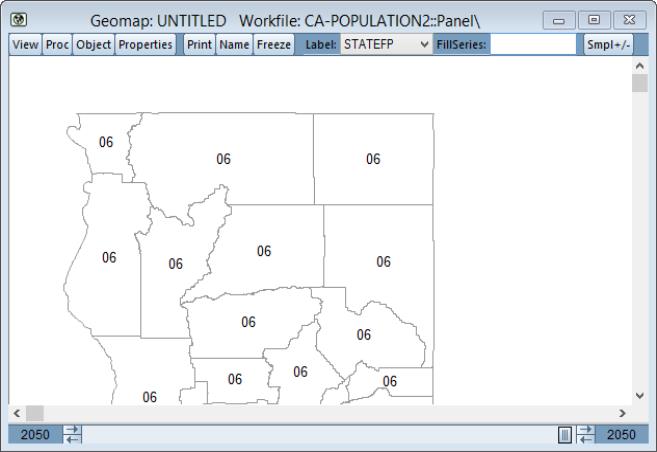
Labeling the Geomap
After loading the shapefile and optionally linking the shapefile to your workfile, you will see a rendering of the shapefile. Each shape will be labeled using the first attribute found in the shapefile. In the example below, STATEFP was the first attribute:
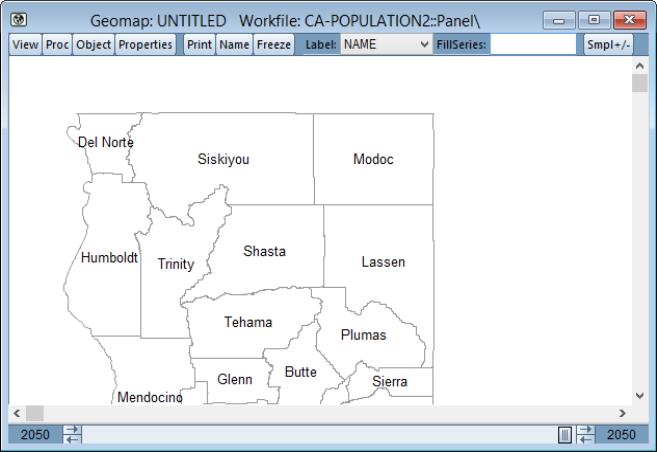
You may change the text label for each shape by choosing an attribute in the dropdown menu. Changing the label to show the NAME attribute yields:
Assigning Fill Values
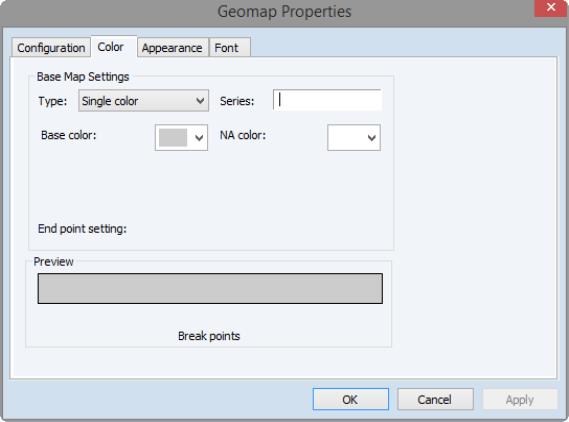
If you have successfully linked the shapes in the shapefile to the observations in the workfile, You may define a colormap to assign values from the workfile to each shape and to use these values for coloring. To set the color settings for each shape, press the button and then choose the tab:
In this example, we are going to define a custom color map that uses the female population series (POP_FEMALE) to determine the fill color (for more on colormaps, see
“Value-Based Text and Fill Coloring”).
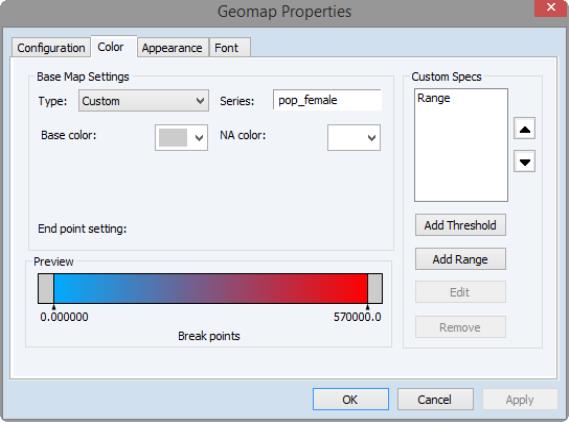
We change the settings in the dialog so that the colors will blend from blue to red as the population ranges from 0 to 570,000, NA will be white, and values outside of the range will be grey:
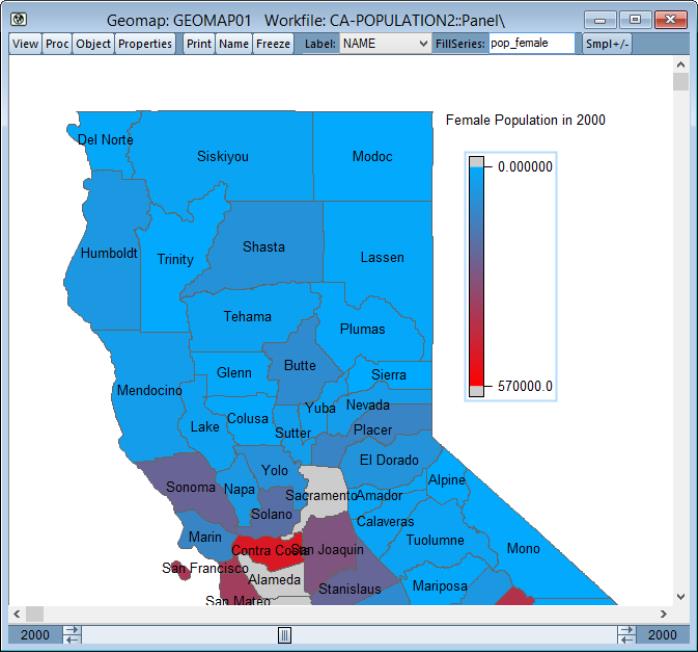
After applying the colormap by pressing in the dialog and changing the slider to 2020, we now see the female population in year 2020:
Hiding Observations and Shapes
Recall that geomap contains all of the shapes in the original shapefile. When you link the observations in your workfile to these shapes, you create a correspondence between observations in the workfile and those shapes.
Note however, that this correspondence may not be complete:
• There may be observations in the workfile that do not have shapes in the shapefile
• There may be shapes in the shapefile which do not correspond to observations in the workfile
Understanding these different classes of observations is important to understanding what EViews will show when drawing a geomap.
By default, EViews will show all of the shapes in the shapefile, whether or not they correspond to an observation in the workfile. You may restrict the display of these shapes in the following fashion:
• You may instruct EViews to filter out shapes corresponding to observations that are not in the current sample by pressing on button.
(Note that when a sample filter is applied, all shapes not associated with observations will also be hidden).
To remove the filter, press the button again to toggle the settings.
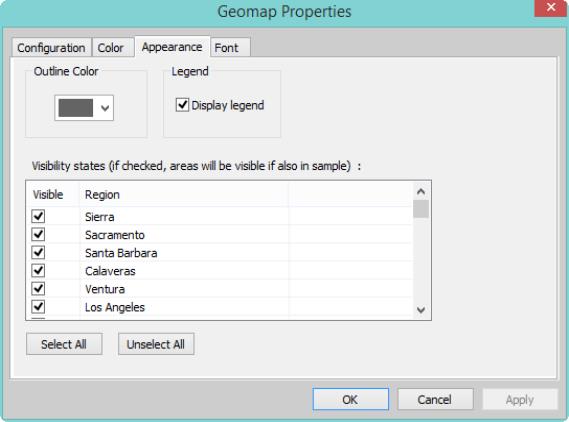
• Additionally, you may instruct EViews to hide specific shapes by clicking on the button and selecting the tab:
Simply check and uncheck the shape regions as desired. Note that the label for each of the shapes is taken from the label setting as described above.
Lastly, note that when applying a sample filter, a region must satisfy both the sample filter and the settings filters. Thus, if an observation is in the current sample, but it’s checkbox is unchecked, it will be hidden. Likewise, if a shape’s checkbox is selected, but the observation is not in the current sample, it will be hidden.
Additional Appearance Settings
The tab has settings for the shape outline color (, and whether to show a colormap legend ().
Navigating the Geomap Display
You may use the scrollers on the right and button of image to view different portions of the image.
The scroller on the right allows you to see different portions of the current geomap display window.
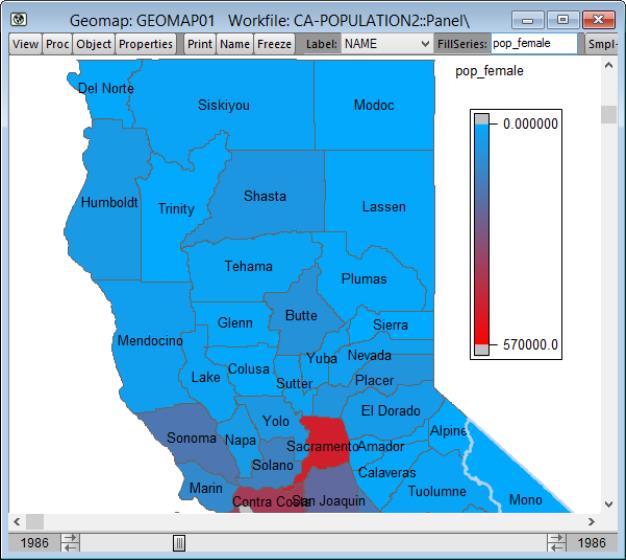
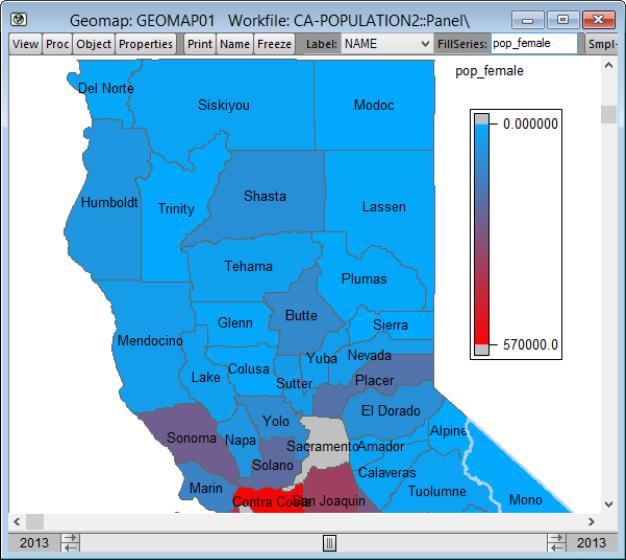
In panel workfile, a sample slider just below the horizontal scrollbar allows you to show the geomap at different time periods. Simply click on the arrows or drag the slider to show a different period.
Here we see the geomap display for the year 2013, which we may contrast with the map for 1986 above.
Switching to label drop-down from to changes the display to show the actual female population values: