Derivatives
EViews employs a variety of rules for computing the derivatives used by iterative estimation procedures. These rules, and the user-defined settings that control derivative taking, are described in detail in
“Derivative Computation”.
In addition, EViews provides both object views and object procedures which allow you to examine the effects of those choices, and the results of derivative taking. These views and procedures provide you with quick and easy access to derivatives of your user-specified functions.
It is worth noting that these views and procedures are not available for all estimation techniques. For example, the derivative views are currently not available for binary models since only a limited set of specifications are allowed.
Derivative Description
The view provides a quick summary of the derivatives used in estimation.
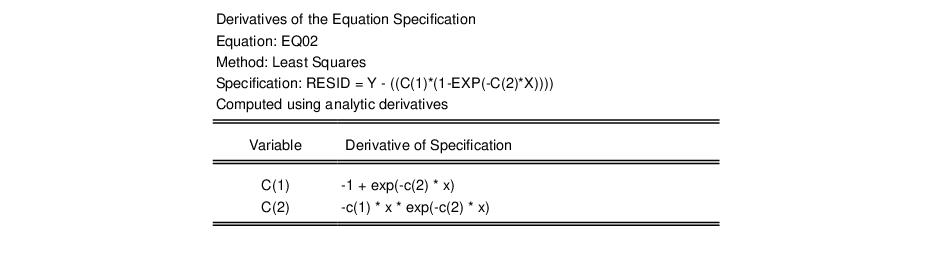
For example, consider the simple nonlinear regression model:
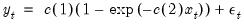 | (60.27) |
Following estimation of this single equation, we can display the description view by selecting
There are three parts to the output from this view. First, the line labeled “Specification:” describes the equation specification that we are estimating. You will note that we have written the specification in terms of the implied residual from our specification.
The next line describes the method used to compute the derivatives used in estimation. Here, EViews reports that the derivatives were computed analytically.
Lastly, the bottom portion of the table displays the expressions for the derivatives of the regression function with respect to each coefficient. Note that the derivatives are in terms of the implied residual so that the signs of the expressions have been adjusted accordingly.
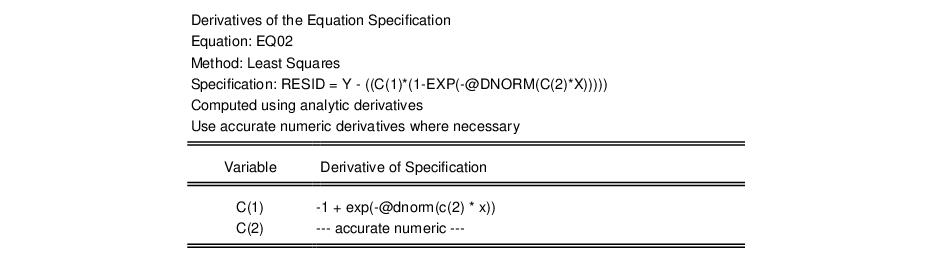
In this example, all of the derivatives were computed analytically. In some cases, however, EViews will not know how to take analytic derivatives of your expression with respect to one or more of the coefficient. In this situation, EViews will use analytic expressions where possible, and numeric where necessary, and will report which type of derivative was used for each coefficient.
Suppose, for example, that we estimate:
 | (60.28) |
where

is the standard normal density function. The derivative view of this equation is
Here, EViews reports that it attempted to use analytic derivatives, but that it was forced to use a numeric derivative for C(2) (since it has not yet been taught the derivative of the @dnorm function).
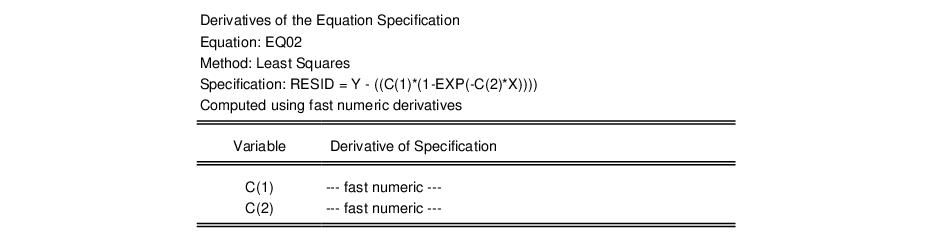
If we set the estimation option so that we only compute fast numeric derivatives, the view would change to
to reflect the different method of taking derivatives.
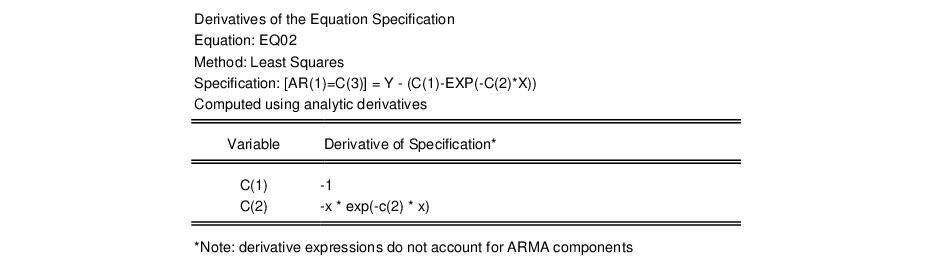
If your specification contains autoregressive terms, EViews will only compute the derivatives with respect to the regression part of the equation. The presence of the AR components is, however, noted in the description view.
Recall that the derivatives of the objective function with respect to the AR components are always computed analytically using the derivatives of the regression specification, and the lags of these values.
One word of caution about derivative expressions. For many equation specifications, analytic derivative expressions will be quite long. In some cases, the analytic derivatives will be longer than the space allotted to them in the table output. You will be able to identify these cases by the trailing “...” in the expression.
To see the entire expression, you will have to create a table object and then resize the appropriate column. Simply click on the button on the toolbar to create a table object, and then highlight the column of interest. Click on on the table toolbar and enter in a larger number.
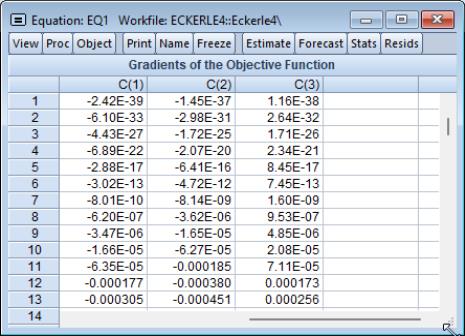
Derivative Table and Graph
Once we obtain estimates of the parameters of our nonlinear regression model, we can examine the values of the derivatives at the estimated parameter values. Simply select to see a spreadsheet view or line graph of the values of the derivatives for each coefficient:
This spreadsheet view displays the value of the derivatives for each observation in the standard spreadsheet form. The graph view, plots the value of each of these derivatives for each coefficient.
Derivative Series
You can save the derivative values in series for later use. Simply select and EViews will create an untitled group object containing the new series. The series will be named DERIV##, where ## is a number associated with the next available free name. For example, if you have the objects DERIV01 and DERIV02, but not DERIV03 in the workfile, EViews will save the next derivative in the series DERIV03.