Draw a line or arrow on a graph.
Syntax
graph_name.addarrow [pos(x1,y1,x2,y2) axispos(x1,y1,x2,y2,x-axis,y-axis) axispos(x1,y1,x2,y2,y-axis) axispt(x2,y2,angle,length,x-axis,y-axis)] linewidth(lwidth) arrowwidth(awidth) color(color) pattern(pattern) startsym(ssym) endsym(esym) label(str) labelpos(position) frame(size) indicator
Follow the addarrow keyword a set of specifications determining the position and style of the line/arrow to be drawn.
The position and size of the arrow/line can be specified with one of the pos, axispos or axispt arguments.
The
pos argument specifies coordinates of the line in virtual space.
x1 is the starting X (horizontal) coordinate, and
y1 is the starting Y (vertical) coordinate. Similarly
x2 and
y2 are the end point coordinates. Coordinates are set in virtual inches. Individual graphs are always

virtual inches (scatter diagrams are

virtual inches) or a user-specified size, regardless of their current display size.
The origin of the coordinate is the upper left hand corner of the graph. The x1 number specifies how many virtual inches to offset to the right from the origin. The second number y1 specifies how many virtual inches to offset below the origin. The start point of the line will be set at the specified coordinates.
The axispos argument specifies coordinates in units of the graph scale. x1 is the starting X (horizontal) coordinate, and y1 is the starting Y (vertical) coordinate. Similarly x2 and y2 are the end point coordinates.
For time-series graphs you must also specify which non-time based axis the y-coordinates’s scale are based on, using l,t,r,b for left, top, right, bottom respectively. x-coordinates should be specified as a date/time.
For non-time series graphs you must specify the axis of scale of both x and y coordinates.
The axispt argument specifies the end point coordinates of the line, along with the angle and length of the line. Angles are measured in degrees, and length in virtual inches.
The linewidth argument specifies the thickness of the line. lwidth should be a number between “.25” and “5”, indicating the width in points.
Arrowwidth determines the size of the arrow head on the line. awidth can be either “small”, “medium” or “large”.
color specifies the color of the line. The color value may set by using one of the color keywords (e.g., “blue”), by using the RGB values (e.g., “@RGB(255, 255, 0)”), or by specifying the components in hexadecimal (e.g., “@HEX(ff0000)”).
The predefined colors are given by the keywords (with their RGB and HEX equivalents):
blue | @rgb(0, 0, 255) | @hex(0000ff) |
red | @rgb(255, 0, 0) | @hex(ff0000) |
ltred | @rgb(255, 168, 168) | @hex(ffa8a8) |
green | @rgb(0, 128, 0) | @hex(008000) |
black | @rgb(0, 0, 0) | @hex(000000) |
white | @rgb(255, 255, 255) | @hex(ffffff) |
purple | @rgb(128, 0, 128) | @hex(800080) |
orange | @rgb(255, 128, 0) | @hex(ff8000) |
yellow | @rgb(255, 255, 0) | @hex(ffff00) |
gray | @rgb(128, 128, 128) | @hex(808080) |
ltgray | @rgb(192, 192, 192) | @hex(c0c0c0) |
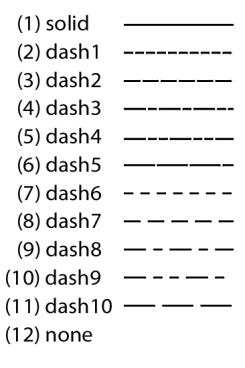
The pattern argument specifies the line pattern. pattern can take a numerical value, or one of the corresponding keywords:
The startsym and endsym arguments define the arrowhead at the start or end of the line. You may specify “none”, “filled”, “outline”, or “rangeline”.
label adds a text label to the start point of the arrow. labelpos specifies the location of the text relative to the start point of the line. The following positions are available:
Vert | left or right of the start point depending on the angle of the line |
Horz | left or right of the start point depending on the angle of the line |
AR | above and right of the start point |
AL | above and left of the start point |
BR | below and right of the start point |
BL | below and left of the start point |
L | left of the start point |
R | right of the start point |
A | above the start point |
B | below the start point |
Frame encloses the text in a box. Size specifies whether the box should be a small box (sb) or a large box (lb).
Indicator places a red indicator within the text frame, indicating the start point location relative to the text. NOTE: The indicator will only appear if the label position (labelpos) is set to AR, AL, BR, or BL
Examples
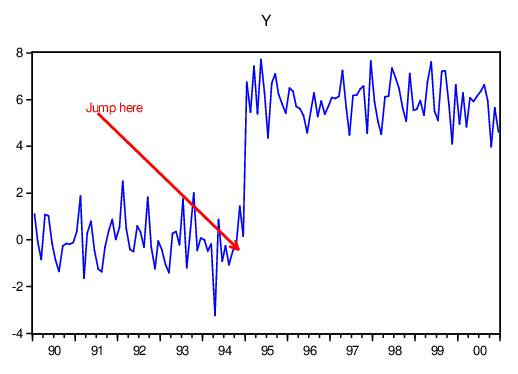
The commands
create m 1990 2000
smpl 1990 1995
series y=nrnd
smpl 1995 2000
y = 6+nrnd
smpl @all
freeze(gr) y.line
gr.addarrow pos(0.7,0.65, 2.2,2.1) color(red) arrowwidth(large) endsym(outline) linewidth(2) label(Jump here)
create a graph and draw an arrow at the specified positions:
The command
gr.addarrow axispos(94, 3, 97, 4.2, l)
adds a second arrow starting at the point corresponding to the year 1994 on the x-axis and the y-axis value of 3, and ending at the year 1997 with a y-value of 4.2.
Cross-references