Draw an ellipse on a graph.
Syntax
graph_name.addellipse [pos(x1,y1,x2,y2) axisctr(x1,y1,x-axis,y-axis) axispos(x1,y1,y-axis)] linewidth(lwidth) color(color) pattern(pattern) height(height) width(width) angle(angle)
Follow the addellipse keyword a set of specifications determining the position and style of the ellipse to be drawn.
The position and size of the ellipse can be specified with either the pos or axisctr arguments.
The
pos argument specifies coordinates of the center of the ellipse in virtual space.
x1 is the center point X (horizontal) coordinate, and
y1 is the center point Y (vertical) coordinate. Coordinates are set in virtual inches. Individual graphs are always

virtual inches (scatter diagrams are

virtual inches) or a user-specified size, regardless of their current display size.
The origin of the coordinate is the upper left hand corner of the graph. The x1 number specifies how many virtual inches to offset to the right from the origin. The second number y1 specifies how many virtual inches to offset below the origin.
The axisctr argument specifies coordinates in units of the graph scale. x1 is the center point X (horizontal) coordinate, and y1 is the center point Y (vertical) coordinate.
For time-series graphs you must also specify which non-time based axis the y-coordinates’s scale are based on, using l,t,r,b for left, top, right, bottom respectively. x-coordinates should be specified as a date/time.
For non-time series graphs you must specify the axis of scale of both x and y coordinates.
The height argument specifies the height of the ellipse. Similarly the width argument specifies its width. angle controls the rotation of the ellipse (in degrees).
The linewidth argument specifies the thickness of the ellipse outline. lwidth should be a number between “.25” and “5”, indicating the width in points.
color specifies the color of the ellipse outline. The color value may set by using one of the color keywords (e.g., “blue”), by using the RGB values (e.g., “@RGB(255, 255, 0)”), or by specifying the components in hexadecimal (e.g., “@HEX(ff0000)”).
The predefined colors are given by the keywords (with their RGB and HEX equivalents):
blue | @rgb(0, 0, 255) | @hex(0000ff) |
red | @rgb(255, 0, 0) | @hex(ff0000) |
ltred | @rgb(255, 168, 168) | @hex(ffa8a8) |
green | @rgb(0, 128, 0) | @hex(008000) |
black | @rgb(0, 0, 0) | @hex(000000) |
white | @rgb(255, 255, 255) | @hex(ffffff) |
purple | @rgb(128, 0, 128) | @hex(800080) |
orange | @rgb(255, 128, 0) | @hex(ff8000) |
yellow | @rgb(255, 255, 0) | @hex(ffff00) |
gray | @rgb(128, 128, 128) | @hex(808080) |
ltgray | @rgb(192, 192, 192) | @hex(c0c0c0) |
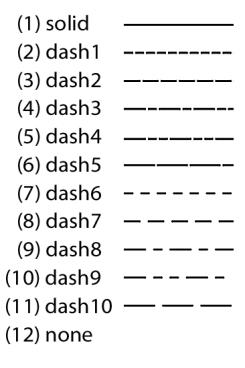
The pattern argument specifies the ellipse outline pattern. pattern can take a numerical value, or one of the corresponding keywords:
Examples
The commands
create m 1990 2000
smpl 1990 1995
series y=nrnd
smpl 1995 2000
y = 6+nrnd
smpl @all
freeze(gr) y.line
gr.addellipse pos(1,1) width(2) height(.7) angle(110) color(red) pattern(2) linewidth(3)
create a graph and adds a red ellipse that is centered 1 virtual inch from the top and 1 virtual inch from the left of the graph that is 2 virtual inches wide and 0.7 virtual inches tall. It uses a 3 pt dash1 line pattern. The ellipse is also rotated 110 degrees
The command
gr.addellipse axisctr(1995, @mean(x),l) width(30) height(.2) angle(-50) color(blue)
adds to a blue ellipse that is centered at 1995 and the mean of x in left axis units. It is 30 observations wide and 0.2 left axis units tall. It is also rotated -50 degrees
Cross-references