Customizing Graphs
EViews allows you to perform extensive customization of your graph object. You may add text, lines and shades, edit or remove existing elements such as legends or titles, or change a wide variety of display settings for the graph.
A graph object is made up of a number of elements: the plot area, the axes, the graph legend, and possibly one or more pieces of added text or shading. To select one of these elements for editing, simply click in the area associated with it. A blue box will appear around the selected element. Once you have made your selection, you can click and drag to move the element around the graph, or double click to bring up a dialog of options associated with the element.
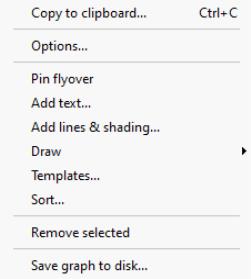
Alternatively, you may use the toolbar or the right mouse button menus to customize your graph. For example, clicking on the graph and then pressing the right mouse button brings up a menu containing entries for customizing, copying and saving the graph.
Adding and Editing Text
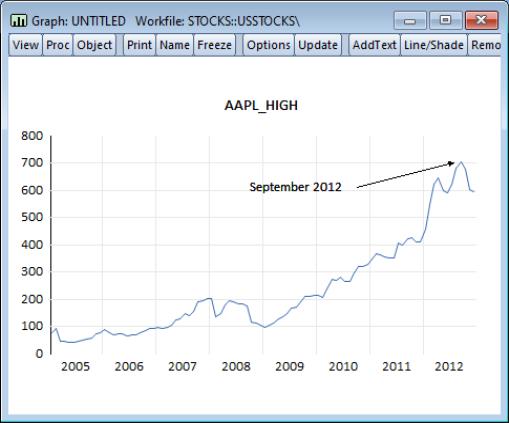
You may customize a graph by adding one or more lines of text anywhere in the graph. Adding text can be useful for labeling a particular observation or period, or for adding titles or remarks to the graph. To add new text, simply click on the button in the graph object toolbar or select from the main graph menu.
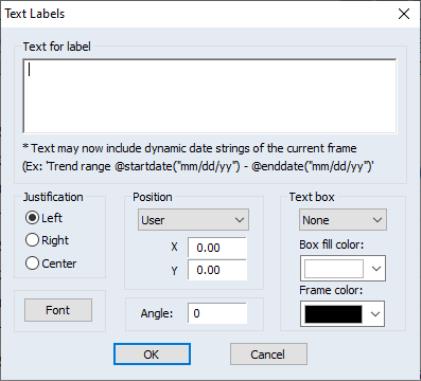
To modify an existing text object, simply double click on the object. The dialog will be displayed.
Enter the text you wish to display in the large edit field. Spacing and capitalization (upper and lower case letters) will be preserved. If you want to enter more than one line, press the key after each line.
• The Justification options determine how multiple lines will be aligned relative to each other.
• Font allows you to select a font and font characteristics for the text.
• Text in Box encloses the text in a box.
• controls the color of the area inside the text box.
• controls the color of the frame of the text box.
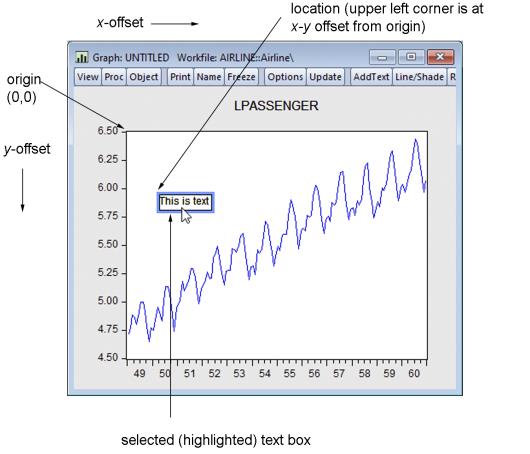
The first four options in Position place the text at the indicated (relative) position outside the graph. You can also place the text by specifying its coordinates. Coordinates are set in virtual inches, with the origin at the upper left-hand corner of the graph.
The X-axis position increases as you move to the right of the origin, while the Y-axis increases as you move down from the origin. The default sizes, which are expressed in virtual inches, are taken from the global options, with the exception of scatter diagrams, which always default to

virtual inches.
Consider, for example, a graph with a size of

virtual inches. For this graph, the X=4, Y=3 position refers to the lower right-hand corner of the graph. Labels will be placed with the upper left-hand corner of the enclosing box at the specified coordinate.
You can change the position of text added to the graph by selecting the text box and dragging it to the position you choose. After dragging to the desired position, you may double click on the text to bring up the dialog to check the coordinates of that position or to make changes to the text. Note that if you specify the text position using coordinates, the relative position of the text may change when you change the graph frame size.
Adding Lines and Shades
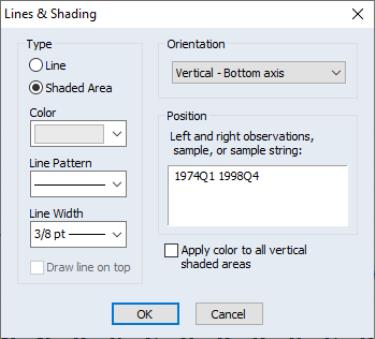
You may draw lines or add a shaded area to the graph. From a graph object, click on the button in the toolbar or select The dialog will appear.
Select whether you want to draw a line or add a shaded area, and enter the appropriate information to position the line or shaded area horizontally or vertically. EViews will prompt you to position either the line with an observation or data value, or the shaded area with an observation, data value, sample object, or sample string.
You should also use this dialog to choose a line pattern, width, and color for the line or shaded area, using the drop down menus.
When adding a line, you may check to instruct EViews to draw the line after drawing the data. This can be useful with filled in areas, such as area or bar graphs.
If you check the checkbox, EViews will update all of the existing lines or shades of the specified type in the graph.
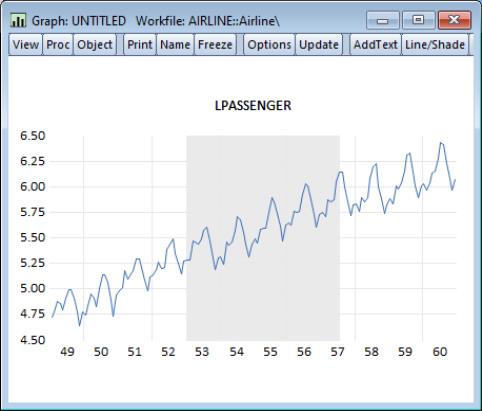
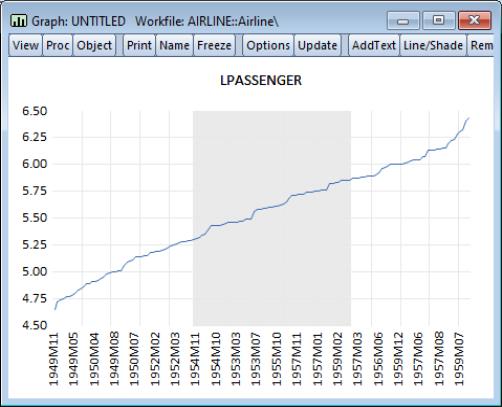
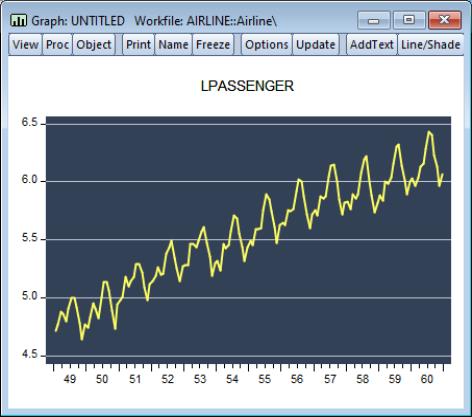
Here we have drawn a vertical shaded area defined by the dates 1953M01 and 1957M07:
To modify a single existing line or shaded area, simply double click on it to bring up the dialog.
Drawing Lines and Arrows
It’s may be useful to accentuate a data point in a graph or draw a comparison between two points. EViews allows you to embellish your graph by drawing custom straight lines anywhere in a graph object window. You may also choose from multiple designs for the arrowheads, including none (plain line), filled arrow, and open arrow.
To add an arrow or line to a frozen graph, place the cursor over the graph, right-click on the mouse, and select . An “X” will appear over the graph. Place the “X” over the starting point for your line, left click the mouse to lock in this point, continue to hold down the mouse button, and move the cursor to the line’s end-point and release the mouse button.
You can change either end-point by placing the cursor over the end, at which point the cursor will change to a white double-ended arrow, then left click the mouse and the cursor will change to a “X”, continue to hold down the mouse key and move the cursor to the line’s new end-point and release the mouse button.
If you select the middle of the arrow the “X” will appear, left-click the mouse and the arrow is selected allowing you to move it without changing the angle and only the position of the line.
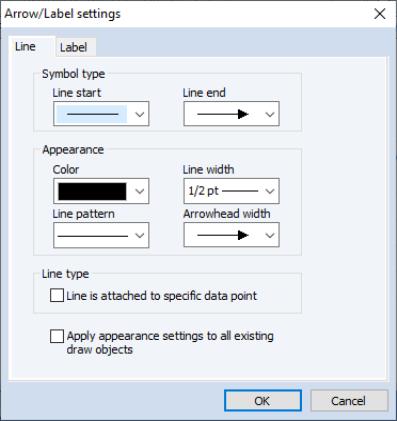
The line appearance can be modified in several ways. If you double-click anywhere on the line, the menu will open, allowing you to choose your starting and ending types. You can also change the color, pattern, width, or arrow appearance. There is also an option that allows you to apply all these settings globally to add continuity to your project in one step.
The undo command is disabled for any changes you make to the graph. To remove an arrow, click on it, and select .
The checkbox allows you to choose whether to anchor in virtual inches relative to the top-left corner of the graph, or whether to anchor the arrow to a data point. See
See “Data-based Anchoring” for additional discussion.
Drawing Rectangles and Ellipses
You may also draw rectangles and ellipses in frozen graph objects.
When the graph object is active, right-mouse click, and select or . The EViews cursor will change to a cross-hair. Click to set a location and then drag to form an object of the desired size.
Once created, you can move and resize the shape interactively. To move, hover over the shape to display the dragging hand cursor. Click and drag to the desired position.
To resize, click once to select the shape and display the positioning nodes. The cursor will change to a double arrow. Drag the node to a new position and release the cursor to resize the shape.
The position, anchor type, size, appearance and angle of the shape may be controlled via dialog. Double-click on the shape to display the dialog:
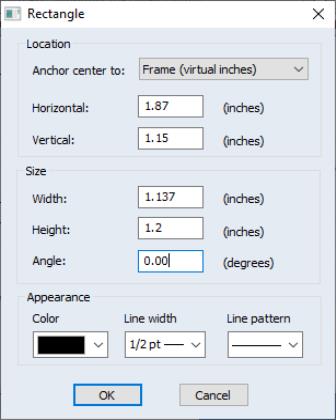
Here, we see the rectangle dialog which allows you to change the location, size, angle, color, width, and pattern of the rectangle.
The top dropdown allows you to choose whether to anchor the rectangle to the (absolute position in virtual inches relative to the top-left corner of the graph), or whether to anchor the rectangle to (position in data and observation units in the graph). See
See “Data-based Anchoring” for additional discussion.
Data-based Anchoring
By default, the positions of arrow and text objects in a graph are specified in virtual inches relative the top left corner of the graph. While useful for some types of drawing, this approach is problematic when one wishes to place objects at particular data points or dates in the graph as in, for example, identifying an outlier or the observation value at a notable date. For one, placing the object is quite difficult programmatically as there is no clear way of translating from data values or observations to virtual inch offset. Moreover, if one changes the axes ranges, sample, or aspect ratio of the graph, the absolute positioning method breaks down.
You can attach arrows and the new rectangle and ellipse drawing objects to fixed data/date points within the graph. You can, for example, choose to place your object at the point defined by the observation for 1991q1 and the maximum value of X.
Similarly, sizes of objects may also be expressed in terms of observations and data units, so that you can draw a rectangle that is “2 years wide” and “10.5” data units tall.
In addition to being easier to specify programmatically, if, you then alter the graph frame or axes, the object will move with the data in the graph.
By default, when you place an arrow, rectangle, or ellipse in a graph, the object placement will use the standard approach of measuring virtual inches relative to the top left corner of the graph.
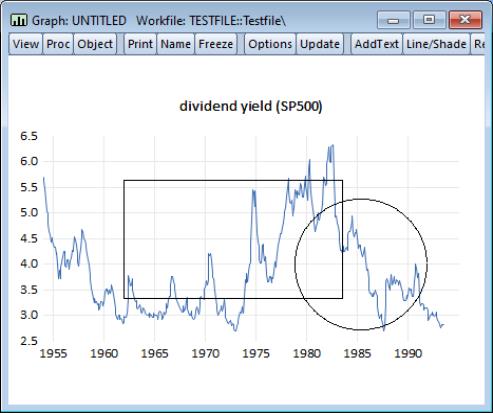
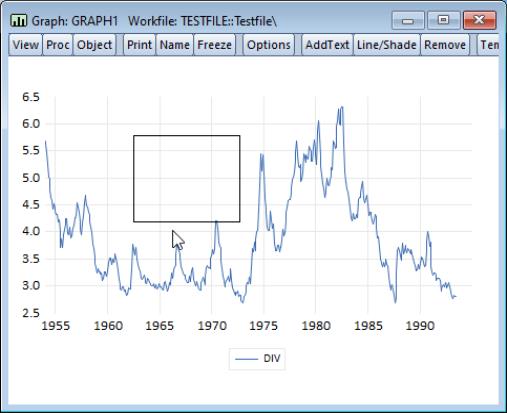
Here we have drawn a rectangle on a graph view of a series.
To modify the anchor point, resize the rectangle, or otherwise change its appearance (size, angle, color, width, and pattern), double click on the shape to bring up the dialog:
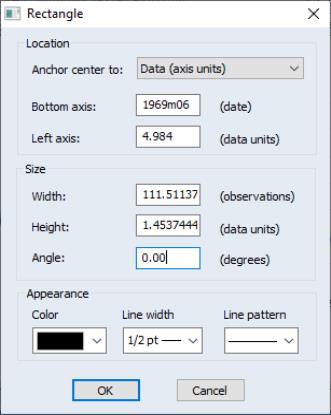
You may use the dropdown to choose between the absolute position method, and the approach. Select
Notice that the units labels for the axes and sizes change and that EViews translates the frame units into observation and data units. We’ll leave the position as is and click on to accept the changes.
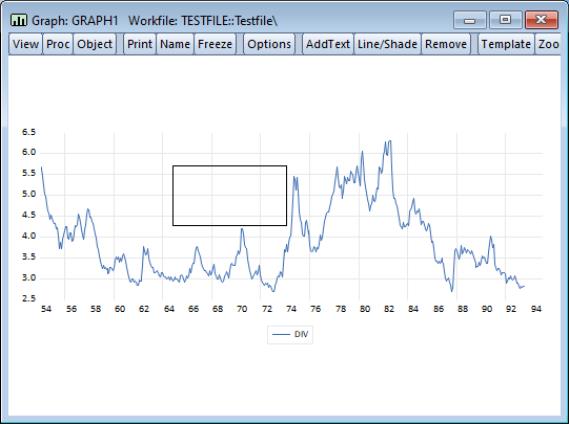
Next, double click on the graph to display the dialog, and select the F node and change the aspect ratio to 1:3 by entering “3” in the edit field. Click on .
(Note: text drawing objects currently do not support the placement using data-based coordinates but you produce a similar effect by creating a data-based graph arrow with label, and making the label of minimal length.)
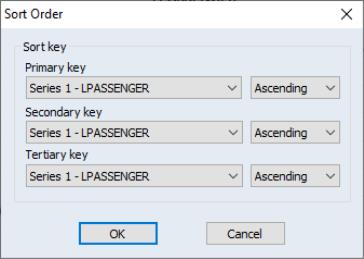
Sorting Graphs
Selecting from the menu or the right mouse-button menu from the brings up the dialog. Providing one or more sort keys will reorder the observations in the graph on the basis of the values of the keys. You may choose to reorder the data in ascending or descending values of the keys.
Note that sorting reorders the data in the graph object, not the underlying data in the original series or matrices.
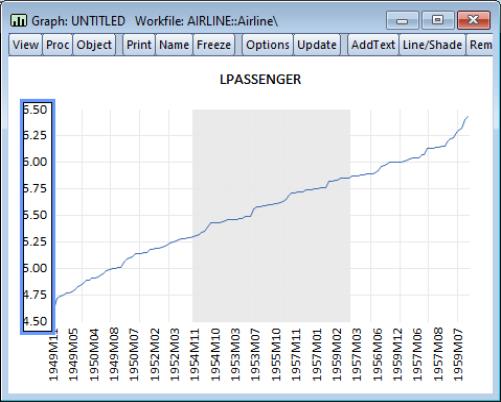
Sorting the graph in ascending order yields:
Notice that EViews displays as much axis label information as possible since the observations are no longer described using a single time scale. Note also that the existing shade is associated with observation numbers and remains in the sorted graph, albeit with a very different interpretation.
Removing Graph Elements
To remove a graph element, simply select the element and press the key. Alternately, you may select the element and then press the button on the graph toolbar. For example, to remove the vertical axis in your graph simply click on the axis. A border will appear around the axis indicating that it is selected.
Simply press or click on the button to delete the scale.
(Double clicking will open the dialog and will show the settings for the vertical axis.)
You may also remove legends, as well as any text, lines or shading which have been added to the graph.
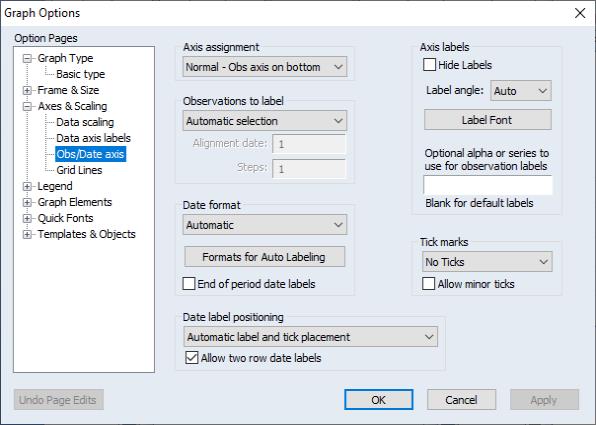
Graph Options
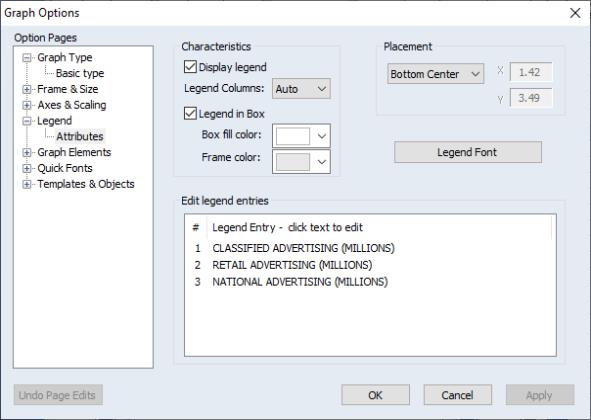
The main dialog controls the basic display characteristics of your graph. The dialog may be opened by selecting from the right mouse menu. You may also double click anywhere in the graph window to bring up the dialog. If you double-click on an applicable graph element (the legend, axes, etc.), the dialog will open to the appropriate page.
Here we have double clicked on the graph’s legend, so the dialog opens to the section. First, note the tree structure on the left-hand side of the dialog. EViews offers a lot of graph options, and to make them more accessible, they have been broken up and organized into groups. Within each group, you will find specific sets of options. Let’s go through these groups one at a time.
Graph Types
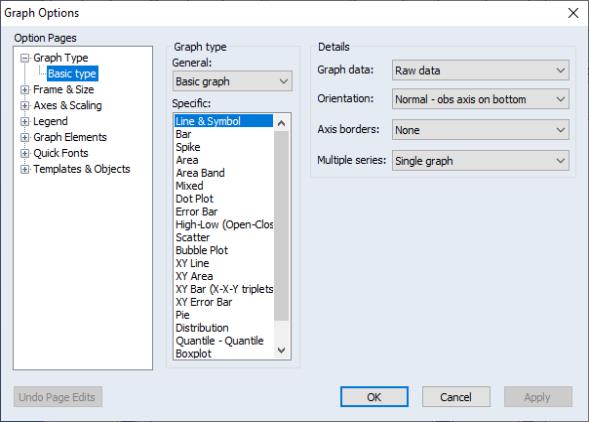
The Graph Type section allows you to change the graph type. Begin by selecting a type from the Basic type page:
The listbox on the left-hand side of the page provides access to the fundamental graph types. The graph types that are available depend on whether the graph uses data from a single series (or column of data, e.g., a vector) or more than one series (or more than one column of a matrix). For example, the , , and , , , and types are only available for graphs containing multiple series or matrix columns.
Depending on the nature of your graph, there are a number of additional settings that may be displayed on the right-hand side of the page:
• – When plotting line, bar, or area graphs with multiple series, EViews displays an option for producing a stacked graph. Simply select to display a stacked graph (see
“Single Series Graphs” for details).
• – In cases where there is potential ambiguity concerning the handling of multiple series in XY graphs (Scatter, XY Line, XY Area, XY Bar), EViews will display a dropdown menu prompting you for whether you want to plot the data using or using (see
“Pairwise Graphs” for discussion).
• – The mixed graph displays multiple series in a single graph frame, with the first series shown as a bar, spike, or area graph, or with the first two series displayed as an area band graph, with the remaining series depicted using lines.
If you select as your graph type, the dialog will change to offer you a choice for the graph type for the first series type. The default setting is . See
“Mixed”.
• – If your data involve sample breaks or missing values, EViews will display additional settings allowing you to control the appearance of your graph. See
“Sample Break & NA Handling” for further discussion.
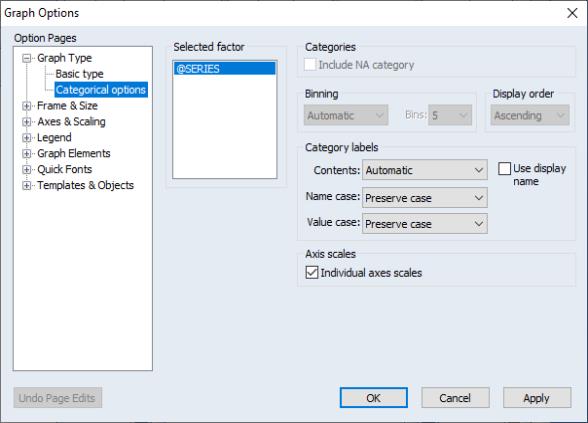
Categorical graphs
If you have selected Categorical graph from the drop-down on the page, a page will also be available under the section:
For a discussion of categorical graphs and use of the page, see
“Categorical Graphs”.
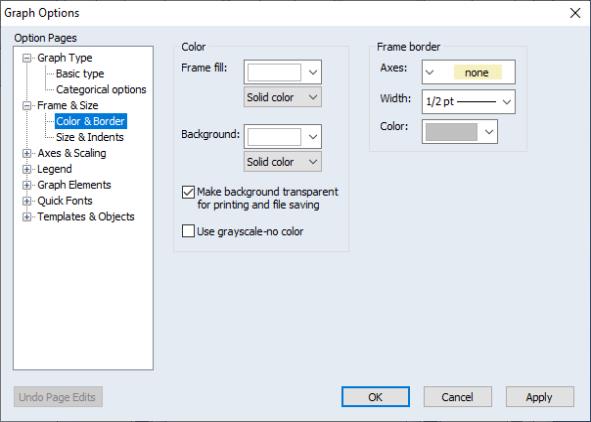
Frame & Size
The Frame & Size section controls basic display characteristics of the graph, including color usage, framing style, indent position, and grid lines.
For discussion of each of these settings, see
“Frame”.
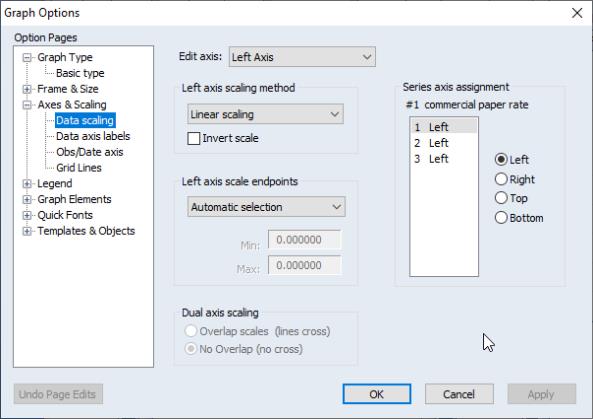
Axes and Scales
To change or edit axes, select the appropriate page from the Axes & Scaling group. The first two sections in this group, and , relate to settings for the data scales. The third section, , sets options for the workfile (observation) scales. The fourth section, , can be used to add or modify grid lines on any axis.
Depending on its type, a graph can have up to four axes: left, bottom, right, and top. Each series is assigned an axis as displayed in the upper right listbox on the page:
You may change the assigned axis by first highlighting the series and then clicking on one of the available axis buttons. For example, to plot several series with a common scale, you should assign all series to the same axis. To plot two series with a dual left-right scale, assign the two series to different axes. To edit characteristics of an axis, select the desired axis from the drop down menu at the top of the dialog.
Adding Custom Labels
EViews offers one of two methods for add custom labels depending on the type or status of the graph and the workfile structure.
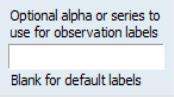
In the , you will see either a button or an edit field at the bottom of the group.
For graphs that are actively updated, such as a graph view or a frozen graph with updating turned on, an edit field will be displayed. Entering an alpha or series name in the field instructs EViews to label each observation with the text or value of the alpha or series. The labels are updated as the values of the alpha or series change. To remove the labels and return to EViews default labels, leave this field blank.
The second approach to adding custom labels allows you to use alpha or numeric series values in a static fashion. The labels are initialized with the current values in the series, but will not be updated if the underlying data change. You may also choose to initialize labels of this type with observation numbers, or simply leave them blank and assign your own text. The labels may be edited as you please, and your changes will not be replaced when the graph is refreshed or the type is changed.
This static method of labeling is used for a graph whose data is no longer changing, such as a frozen graph with updating off. If stored labels can be used, you will see the or button in place of the edit field.
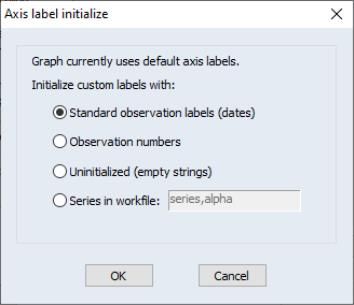
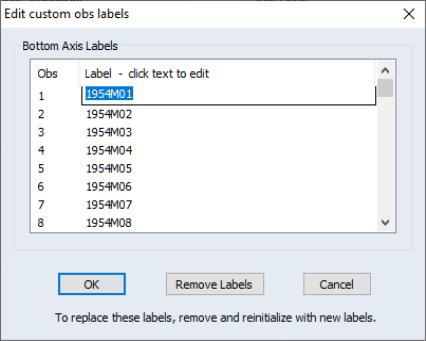
To initialize the labels, click the button to bring up the dialog. Select either , (taken from the workfile), , or , providing an alpha or series name if you chose the latter. Click on to accept your selection.
A dialog will open allowing you to edit the label associated with each observation. Here we have initialized the custom labels with the workfile labels.
If you wish to return to the default axis labels, click the button in the dialog. All custom labels will be deleted and replaced with the default labels.
EViews does its best to preserve labels you have assigned to a Graph. For example, say you have created a graph view and assigned labels based on an alpha series in the workfile. When you’re ready to turn off updating and obtain a snapshot of the current graph, EViews will hold on to the labels from the alpha series. you may now move the graph to a different workfile page or delete the alpha series completely, and the graph labels will be preserved.
See
“Axes & Scaling” for additional detail.
Legend
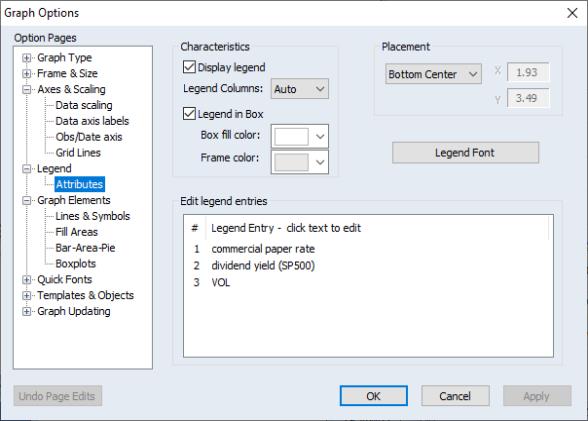
To edit the graph legend characteristics, select the Attributes page of the Legend group.
You may change the basic characteristics of the legend (number of columns, enclose it in a box with specified fill and frame color, change the font, and change the placement) using the settings on the top half of the page.
Use the bottom half of the dialog to change the legend text. Simply click on the specified item in the list box, and then click in the edit field and alter the text.
Note that if you place the legend using user-specified (absolute) positions, the relative position of the legend may change if you change the graph frame size.
Lines and Symbols
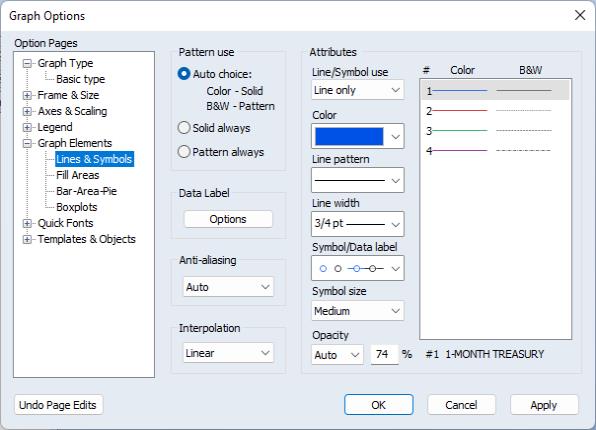
The page under the group provides you with control over the drawing of all lines and symbols corresponding to the data in your graph.
The current line and symbol settings will be displayed in the listbox on the right-hand side of the dialog. You may choose to display lines, symbols, or both, and you can customize the color, width, pattern, and symbol usage. Once you make your choices, click on to see the effect of the new settings.
See
“Lines and Symbols” for additional detail.
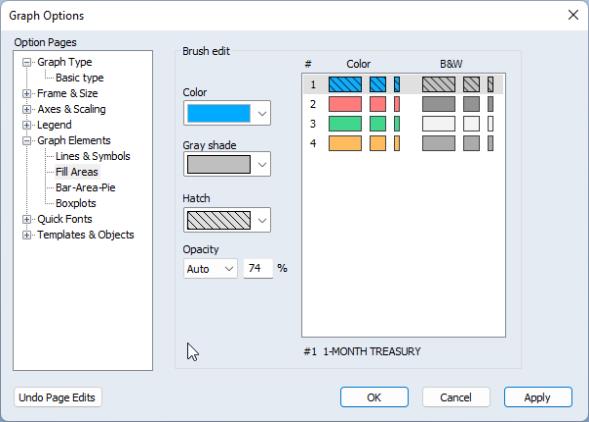
Fill Areas
The page under the group allows you to control the display characteristics of your area, bar, or pie graph. Here, you may customize the color, shading, and hatching pattern of the graph elements.
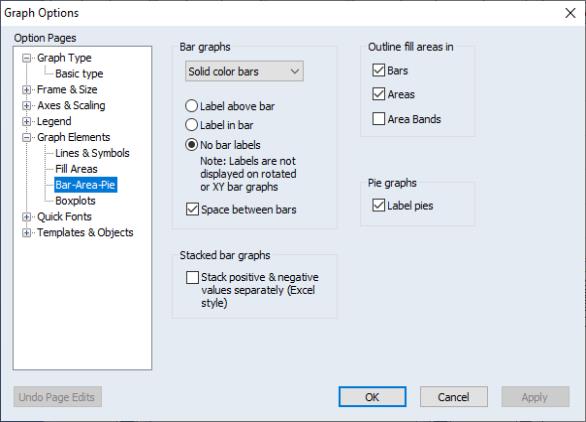
Bar-Area-Pie
The page under the group provides additional options for bar, area, or pie graphs. You may add data labels to bar graphs, as well as modify the bars visually by adding shading or a 3D appearance. You may also specify if fill areas should be outlined.
“Fill Areas” provides additional discussion.
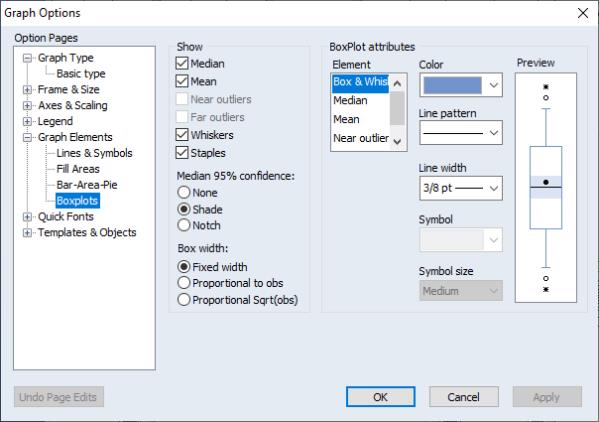
Boxplots
The final page of the group, , provides control over all elements of a boxplot. As with the line and fill area dialogs, these options are only applicable if you have chosen boxplot as your graph type.
The left-hand side of the dialog allows you to select which boxplot elements should be visible, and to specify which method should be used to display the confidence interval. On the right-hand side of the dialog, you may modify the characteristics of each boxplot element individually. Each element may have a unique color, symbol, line pattern, or width.
See
“Boxplot” for a discussion of boxplots.
Quick Fonts
The page lets you specify multiple fonts simultaneously, overriding the settings on other pages.
Note that changes to text objects cannot be undone after you press the button.
Templates
Having put a lot of effort into getting a graph to look just the way you want it, you may want to use the same options in another graph. EViews allows you to use any named graph as a template for a new or existing graph. You may think of a template as a graph style that can be applied to other graphs.
In addition, EViews provides a set of predefined templates that you may use to customize the graph. These predefined templates are not associated with objects in the workfile, and are always available. The EViews templates provide easy-to-use examples of graph customization that may be applied to any graph. You may also find it useful to use the predefined templates as a foundation for your own graph template creation.
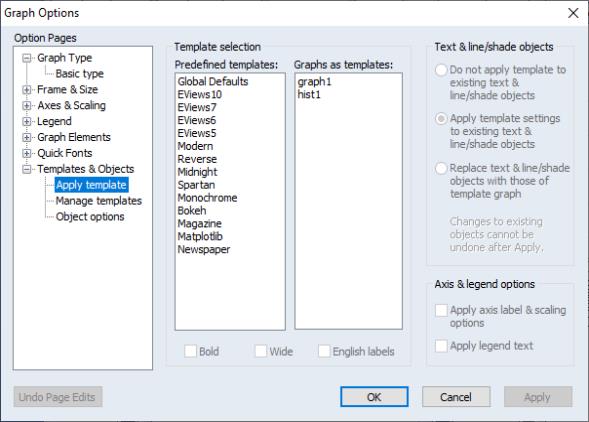
To update a graph using a template, double click on the graph area to display the dialog, and click on under the group. Alternatively, you may right mouse click, and select to open the desired page of the dialog.
On the left-hand side of the dialog you will first select your template. The left-hand list box contains a list of the EViews predefined templates. The right-hand box contains a list of all of the named graphs in the current workfile page. In this dialog, we have selected the graph object GRAPH01 for use as our graph template.
If you select one of the templates, you will be given the choice of applying the , , or modifiers to the base template. As the name suggests, the modifier changes the settings in the template so that lines and symbols are bolder (thicker, and larger) and adjusts other characteristics of the graph, such as the frame, to match. The modifier changes the aspect ratio of the graph so that the horizontal to vertical ratio is increased.
The modifier changes the base template’s settings for auto labeling the date axis. When are applied, labels using month formatting will default to English month names. For example, with turned on, the axis may read: “Jan”, “Feb”, “Mar”, while otherwise it may read: “M1”, “M2”, “M3”.
Applying the template to the example graph yields:
Applying with the and modifiers selected yields:
You may reset the dialog by clicking on the button prior to clicking on .
When you click on the or button, EViews will immediately update all of the basic graph settings described in
“Graph Options”, including graph size and aspect ratio, frame color and width, graph background color, grid line options, and line, symbol, and filled area settings.
In contrast to the basic graph settings which are always updated when you click on or , the effects of using the template on the characteristics of existing text, line, and shade objects in the graph is controlled by the choices on the right-hand side of the dialog. There are three possibilities:
• Do not apply template to existing text & line/shade objects – instructs EViews to use the text, line, and shade attributes in the template or template graph only for the purpose of updating the default settings in the graph. If you select this option and select , subsequently added text, line, and shades will use the updated settings, but existing objects will retain their existing characteristics.
• – will update both the settings for existing text, line, and shade objects, and the defaults used for newly added objects.
• Replace text & line/shade objects with those of the template graph – will first remove any added text label, line, or shading objects in the existing graph, and then copy to the graph any such objects in the template.
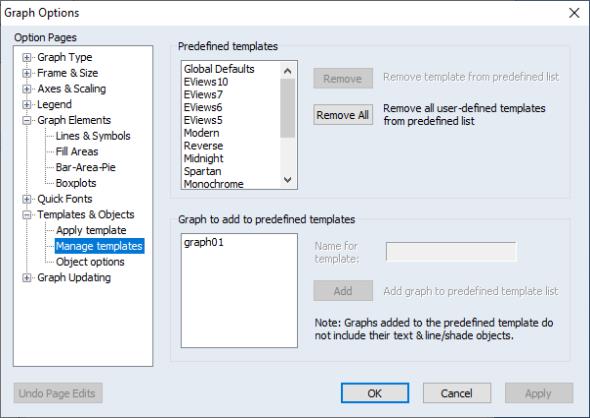
If you have a template graph that you wish to apply to graphs in other workfiles, you may add it to the global template list so it will be accessible from any workfile. Click on under the group. The listbox in the top middle of the dialog shows all existing global templates, including the EViews predefined templates. These templates are stored globally and may be accessed from any workfile. The listbox on the bottom of the dialog shows all named graphs in the current workfile page that have not already been added to the predefined template list.
To add a graph to the predefined template list, select it from the listbox on the bottom and click the button. The graph will then move into the predefined list on the top of the dialog and will be removed from the list on the bottom. Before clicking the button, you may wish to give the graph template a different name by editing its name in the edit field to the right of the listbox.
Similarly, to remove a graph from the predefined list, select it from the listbox on the top of the dialog and click the button. This will remove the graph from the template list, but will not affect the graph object itself. Note that the EViews predefined templates cannot be removed.
Objects
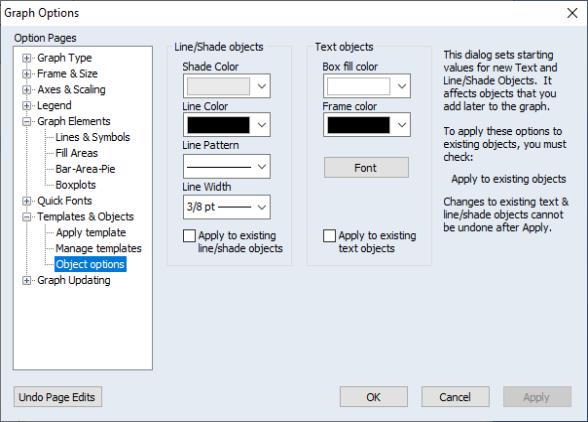
Also under the group, the dialog allows you to control the default characteristics of new text, shade, or line drawing objects later added to the graph, or to update the characteristics of the existing objects.
You may select colors for the shade, line, box, or text box frame, as well as line patterns and widths, and text fonts and font characteristics.
By default, when you apply these changes to the graph object options, EViews will update the default settings in the graph, and will use these settings when creating new line, shade, or text objects. Any existing lines, shades or text in the graph will not be updated. If you wish to modify the existing objects to use the new settings, you must check the and boxes prior to clicking on the button.
Note that you may change the default settings for any of these options by selecting from the main EViews menu. Any new graph views or objects will use the updated options as the default settings.
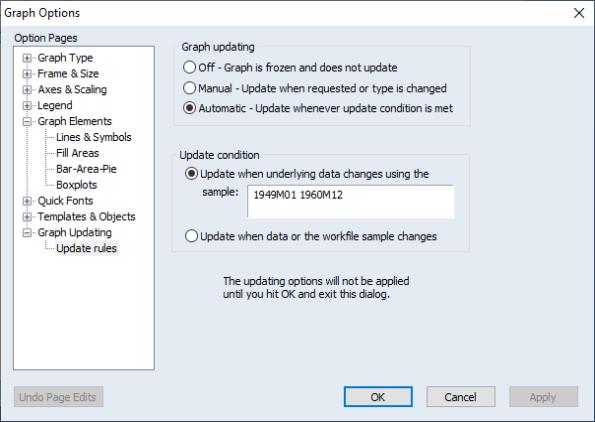
Graph Updating
For graphs which may still be tied into underlying data, you will be offered the opportunity to specify auto updating settings. The section allows you to change options for how and when the graph is updated when its underlying data changes or the workfile sample is modified.