Creating Graph Objects
Graph objects are usually created by freezing an object view. Simply press the button in an object window containing a graph view.
It is important to keep in mind the distinction between a graphical view of an object such as a series or a group, and a graph object created by freezing that view.
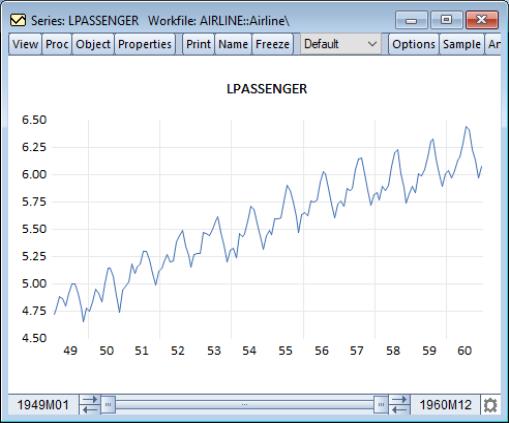
For example, suppose you wish to create a graph object containing a line graph of the series LPASSENGER from the workfile “Airline.WF1”. To display the line graph view of the series, select from the LPASSENGER series menu and selectfrom the listbox in the middle of the dialog. Notice the “Series: LPASSENGER” designation in the window titlebar that shows this is a view of the series object.
You may customize this graph view in any of the ways described in
“Customizing a Graph”, but many of these changes will be lost when the view is redrawn,
e.g. when the object window is closed and reopened, when the workfile sample is modified, or when the data underlying the object are changed. If you would like to keep a customized graphical view, say for presentation purposes, you should create a graph object from the view.
Freezing a Graph View
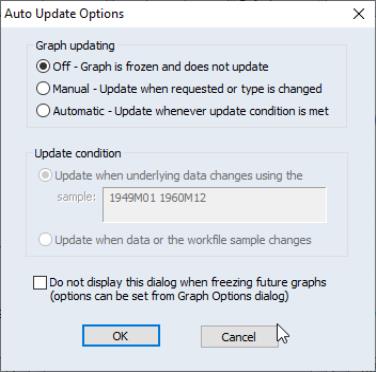
To create a graph object from the view, click on the button. EViews opens the dialog, prompting you to chose whether to make your new graph updating, and if so, to specify a few update options. Let’s discuss the difference between an updating and a non-updating frozen graph.
Selecting will create an untitled graph object containing a snapshot of the view. (This option mimics the behavior of the button in EViews prior to version 7.) The data has been copied from the series and is stored in its current state in the graph object. Changes to the series data will not affect the graph.
Alternately, choosing or will create an updating graph. This means that the underlying graph data is still tied to the original series, so when the series values change, the graph has the opportunity to update as well.
The choice between and is based on when you would like the graph to respond to changes in the data. Selecting allows you to control when the updates occur. The graph will remain the same until you push the button on the graph toolbar, or until the graph type is changed. Choose if you’d like EViews to keep the graph current with changes to the underlying data.
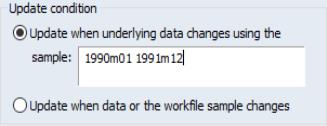
Whether you are working with a manually or automatically updating graph, you can specify how you would like changes in the data or workfile sample to affect the graph when it is updated. Selecting either or will enable the section of the dialog. If you’d like the graph to plot over a constant sample that may or may not match the current sample of the workfile, select the first option, . Enter the desired sample in the edit field, or simply accept the current default sample. The graph will now only update data that fits within the specified sample period. In addition, changes to data outside of this sample period will not trigger an update for automatically updating graphs.
Alternately, select to accept all changes to the data and workfile sample when the graph is updated. Note this means that a change in the workfile sample will be reflected in the graph, whereas the option keeps the graph sample constant unless you change it in the main dialog.
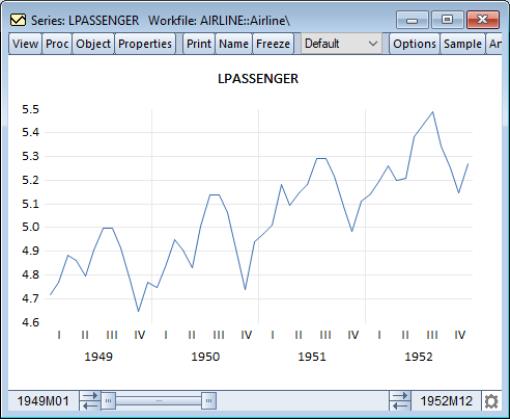
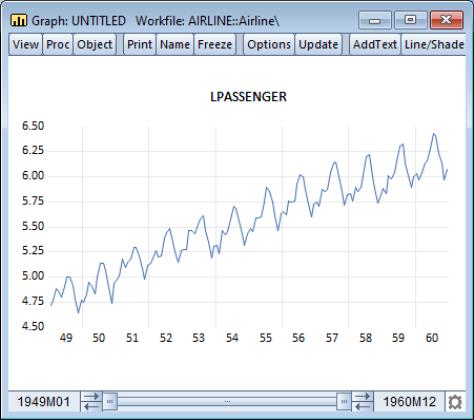
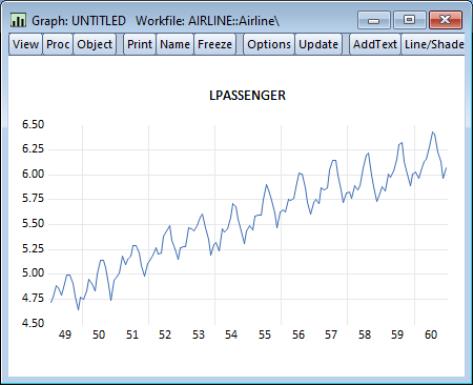
For example, let’s look at freezing the line graph view of the series LPASSENGER. The workfile contains monthly data from 1949 through 1960. First, we’ll concentrate on a portion of the data by changing the workfile sample period to 1949 through 1952. Then freeze this view, selecting updating and in the group. Leave the default sample in the edit field to restrict the graph to changes within the first few years of the workfile data. Click to create an untitled graph object.
Now, let’s see how changes to the series data affect the frozen graph. If we change the value at 1949M01, we’ll see the graph plotting the new value. However, modifying the value at 1956M01 has no effect on the graph, since this date is outside the graph’s sample range.
The real difference between the two options in the group can be seen when we modify the workfile sample. Since we have specified an update sample for the current graph, changes to the workfile sample will not have an effect on the graph.
Alternately, if we had selected in the dialog when freezing the graph, we would see different behavior. Create a graph with the second , and then expand the workfile sample back to 1949 through 1960. Once updated, the graph will expand its sample to match that of the workfile.
Don’t worry if you’re not sure which choice to make for any of these options. You can always make changes after the graph has been created from the main dialog, under the section (
“Graph Updating”). Even if you’ve chosen to create a non-updating graph, you can always switch the graph to update from this dialog, provided the original series or group still exists in the workfile.
Now, let’s talk about the graph objects we’ve been creating.
Here, the titlebar shows that we have an untitled graph object. Notice also that since we are working with a graph object, the menu bar provides access to a new set of views and procedures which allow you to further modify the contents of the graph object.
As with other EViews objects, the UNTITLED graph will not be saved with the workfile. If you wish to store the frozen graph object in your workfile, you must name the graph object; press the button and provide a name.
There’s one other thing to notice in the titlebar. A graph with updating turned off will have a green icon in the upper left-hand corner, while a graph with updating turned on will have an orange icon. These colored icons will also be seen in the workfile window, once the graph has been named. You may also verify (or modify) the updating status using the section of the graph options dialog (
“Graph Updating”).
