Place horizontal or vertical lines and shaded areas on the graph.
Syntax
graph_name.draw(draw_type, axis_id [,options]) position [position2]
where draw_type may be one of the following:
line / l | A line |
shade | A shaded area |
Note that the “dashline” option has been removed (though it is supported for backward compatibility). You should use the “pattern” option to specify whether the line is solid or patterned.
axis_id may take the values:
left / l | Draw a horizontal line or shade using the left axis to define the drawing position |
right / r | Draw a horizontal line or shade using the right axis to define the drawing position |
bottom / b | Draw a vertical line or shade using the bottom axis to define the drawing position |
If drawing a line, the drawing position is taken from position. If drawing a shaded area, you can either specify a start and end position (position and position2), sample object, or sample string to define the boundaries of the shaded region.
Line/Shade Options
The following options may be provided to change the characteristics of the specified line or shade. Any unspecified options will use the default text settings of the graph.
color(arg) | Specifies the color of the line or shade. arg may be one of the predefined color keywords, or it may be specified using individual red-green-blue (RGB) components using the “@RGB” or “@HEX” functions. The arguments to the @RGB function are a set of three integers from 0 to 255, representing the RGB values of the color. The arguments to the “@HEX” function are a set of six characters representing the RGB values of the color in hexadecimal. Each two character set represents a red, green or blue component in the range '00' to 'FF'. For a description of the available color keywords see
“Color definitions”. The default is black for lines and gray for shades. RGB values may be examined by calling up the color palette in the dialog. |
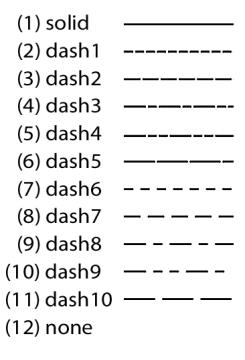
pattern(index) | Sets the line pattern to the type specified by index. index can be an integer from 1 to 12 or one of the matching keywords (“solid”, “dash1” through “dash10”, “none”). The “none” keyword turns on solid lines. |
width(n1) | Specify the width, where n1 is the line width in points (used only if object_type is “line” or “dashline”). The default is 0.5 points. |
top | Specifies that the line be drawn on top of the graph. (Note that this option has no effect on shades.) |
Color definitions
color_arg specifies the color to be employed in the arguments above. The color may be specified using predefined color names, by specifying the individual red-green-blue (RGB) components using the special “@RGB” function, or by specifying the individual red-green-blue (RGB) components in hexadecimal using the special “@HEX” function.
The predefined colors are given by the keywords (with their RGB and HEX equivalents):
blue | @rgb(0, 0, 255) | @hex(0000ff) |
red | @rgb(255, 0, 0) | @hex(ff0000) |
ltred | @rgb(255, 168, 168) | @hex(ffa8a8) |
green | @rgb(0, 128, 0) | @hex(008000) |
black | @rgb(0, 0, 0) | @hex(000000) |
white | @rgb(255, 255, 255) | @hex(ffffff) |
purple | @rgb(128, 0, 128) | @hex(800080) |
orange | @rgb(255, 128, 0) | @hex(ff8000) |
yellow | @rgb(255, 255, 0) | @hex(ffff00) |
gray | @rgb(128, 128, 128) | @hex(808080) |
ltgray | @rgb(192, 192, 192) | @hex(c0c0c0) |
Examples
graph1.draw(line, left, @rgb(0,0,255)) 5.25
draws a horizontal blue line at the value “5.25” as measured on the left axis while:
graph1.draw(shade, right) 7.1 9.7
draws a shaded horizontal region bounded by the right axis values “7.1” and “9.7”. You may also draw vertical regions by using the “bottom” axis_id:
graph1.draw(shade, bottom) 1980:1 1990:2
draws a shaded vertical region bounded by the dates “1980:1” and “1990:2”.
graph1.draw(shade, bottom, @rgb(255,0,0)) 1980:1 1990:2 if x>.5
draws red shaded vertical regions bounded by the dates “1980:1” and “1990:2” where the series x has a value greater than .5.
graph1.draw(shade, bottom, @rgb(0,128,0)) mysample
draws green shaded vertical regions that match the mysample object.
graph1.draw(line, bottom, pattern(dash1)) 1985:1
draws a vertical dashed line at “1985:1”.
Cross-references
See
“Graph Objects” for a discussion of graph options.
See
Graph::drawdefault for setting defaults.
