Dated Data Table
The dated data table view of a group offers sophisticated tools to help you construct tables that combine original data along with transformations, frequency conversions, and summary statistics of the data.
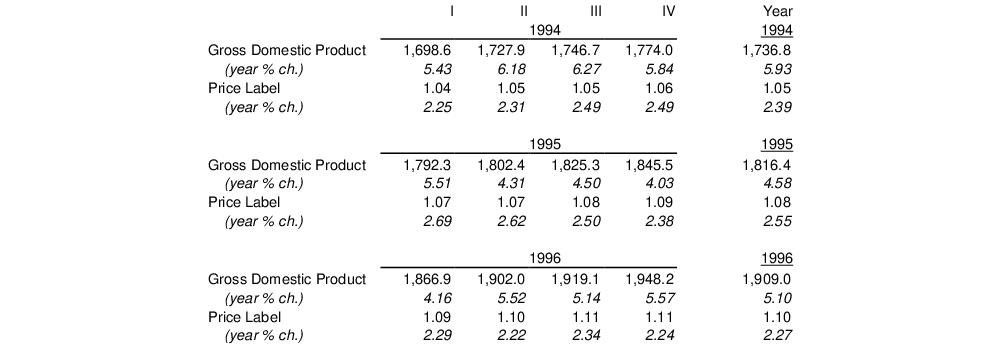
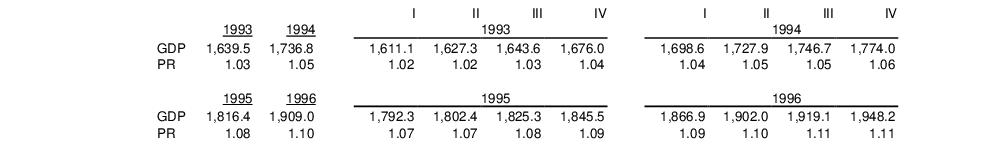
Time series data, forecasts, and simulation results are often presented in complex tables that are constructed to highlight various aspects of the data. Suppose, for example, that you wish to display values of the quarterly GDP and PR series in the years 1994–1996 (in the workfile “Demo.wf1”), along with the annual average, arranged by year:
Or perhaps you wish to display the original data along with the one-year percent changes with more descriptive display labels taken from the series:
Alternatively, you may wish to display annual averages for each year, followed by the last four quarterly observations in your sample:
In all three of these examples, the dated data table view offers an easy-to-use set of tools for quickly specifying the form of the table, performing the required calculations, and arranging the results into attractive output.
You can even use the dated data table to input data by constructing a table that matches the format of a published tables and editing the dated data table cells to match.
Creating a Dated Data Table
To display the dated table view you must first create a group object containing the series of interest. Once you have created the group, simply select to construct the table.
(Note that due to the nature of the operations involved in constructing a dated data table, the view is only available in an annual, semi-annual, quarterly, or monthly workfile.)
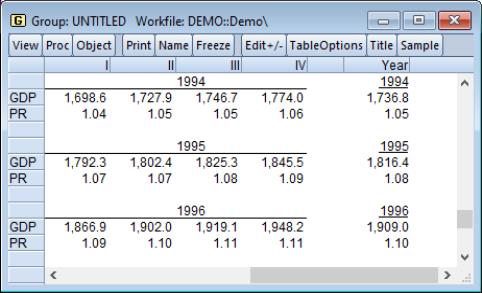
The group window will change to display a dated data table view created using the current workfile sample and the default dated data table settings:
At the default settings, each line contains a single year of data for each series, at the original (non-annual) frequency along with the annual average, or each line will show up to five years of data in an annual workfile.
Customizing a Dated Data Table
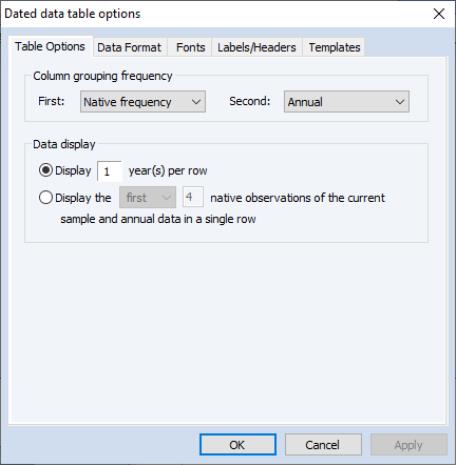
You may set options to customize an existing dated data table view through the dialog. First create a dated data table, then click on the button on the toolbar to open the dialog.
The dialog has four separate tabs: Table Options, Data Format, Fonts, and Labels/Headers. We will discuss, in turn, the use of each of these settings for customizing the contents and look of your dated data table.
Note that once you modify the dated data table options for a group, EViews will remember these settings the next time you open the view for the group.
Table Options
The first tab in the dialog, Table Options, provides options to control the general style of the table.
You may use these settings to specify whether you want the annual data arranged on the left-hand side of the table with a year’s worth of monthly data on the right, the native data on the left and the quarterly data on the right, any other combination of native and lower frequency data, or data at a single frequency.
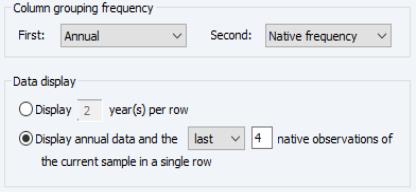
Defining the Column Groupings
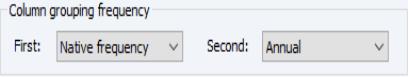
The dated data table view displays data in one or two groups of columns. The contents of the groups are defined in the section of the page. The and drop-down menus determine the contents of the two groups. You may choose from a subset of the following:
• (the frequency of the workfile)
•
•
•
• (only available for the second set of columns)
with the available choices depending on the native frequency of the workfile (only native or lower frequencies are allowed) and on the column grouping.
By default, the drop-down will be set to .Given this setting, the first group of columns will contain data at the original workfile frequency. For example, if your workfile contains monthly data, then the first group will contain monthly data; if your workfile is quarterly, the group will contain quarterly data.
You may instruct EViews to display the underlying data at a lower frequency in the first group of columns. You may, for example, choose to display your monthly workfile data at a quarterly or an annual frequency. EViews will perform a frequency conversion to the desired lower frequency using the conversion method specified in
“Data Format”, and will display those results in the first group.
By default, the menu is set to so that the second group of columns is actually a single column of annual data. EViews will convert the data from the native frequency to an annual frequency using the conversion method specified in
“Data Format”.
You may use the drop-down menu to select or any lower frequency, or you may select to remove the second block of columns.
If the specified settings for the first and second groups produce duplicate data, EViews will remove groups of columns to eliminate redundancy. Thus, if you have an quarterly workfile and select and , respectively, duplicate quarterly results will not be shown.
Specifying the Data in a Line
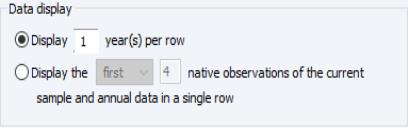
The Data display area allows you to control the amount of data contained in each line of table output. You may choose between displaying multiple years of data in a row or displaying a single year of data with a subset of observations from that year.
To select multiple years of data, select the first radio button and enter the number of years per row you would like to display. The data displayed will be for the years included in the current workfile sample only (note this means that if your sample starts half way through a year, EViews will display all periods of that year, including those prior to the start of the sample, if they exist in the workfile).
The impact of selecting the second radio button depends upon the selection in the Column grouping frequency area. If you have chosen to show annual data in one of the column groupings, selecting the second radio button will tell EViews to display a row with a single entry for each year in your current workfile sample for that column grouping.
If you have chosen a non-annual frequency for one of the column groupings, selecting the second radio will tell EViews to only display observations from either the start () or end () of the first year of your sample in that grouping. You can enter the number of periods/observations you would like to show.
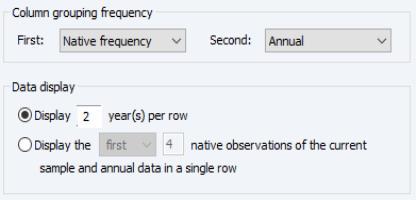
The effects of these choices on the table display are best described by the following examples. For purposes of illustration, note that the current workfile is quarterly, with a current sample of 1993q1–1996q4.
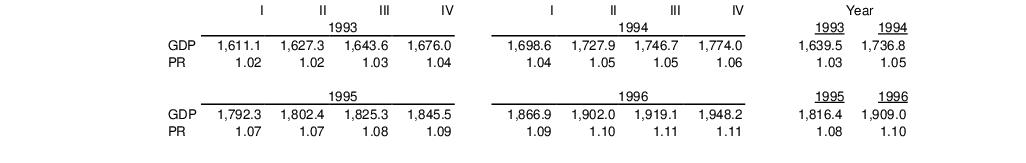
Now suppose that you choose the first style with 2 years of data, with the first columns set to the native frequency, and the second columns set to annual frequency.
Each row of the resulting table will contain eight quarters of data (two years of the native frequency data) followed by two annual observations (two years of the annual frequency data):
EViews automatically performs the frequency conversion to annual data using the specified method (see
“Transformation Method”).
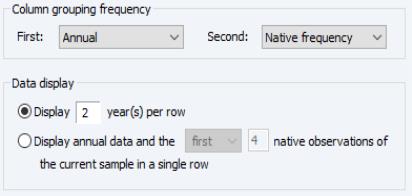
If you reverse the ordering of data types in the first and second columns so that the first columns display the annual data, and the second columns display the native frequency,
the resulting dated data table will contain:
Lastly, specify Annual for the first columns and Native frequency for the second columns. Then choose the second display style, select , and enter “4” in the edit box:
EViews will display the annual data for all four years of the current sample, followed by the last four native (quarterly) observations:
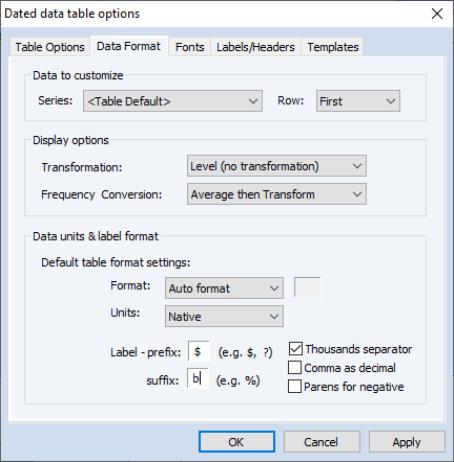
Data Format
Where the tab (
“Table Options”) determines the basic layout of the table and the frequencies at which you will display the data, the tab of the dialog determines the actual values and display formats of the data in the table.
The settings in this tab control:
• whether to display one or two lines of values for each series in the group
• whether to display the original data or transformations of the data
• the method for performing any frequency conversion
• the format for displaying the numbers
Select Data to Customize
The first step in setting the data format is to select the table elements for which you wish to change settings. You will find the controls for selecting data in the section of the dialog.
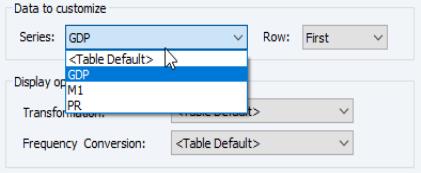
• The dropdown allows you to specify the data format for all of the series in the table, or for a specific series.
Select the <Table Default> entry to specify default settings for all of the series in the table. Changes to the display options and formatting of the table defaults will affect all series which employ default settings.
To modify the settings for a specific series, select the name of the series in the dropdown menu.
• The dropdown lets you choose whether to change the data format settings for the first or for the second display row of the element selected in .
EViews allows you to display either one or two rows for each series. You may, for example, display the levels of the series in one row and the 1-period percent change in a second row. Changing the drop-down between or in allows you to choose whether to modify settings for the first or the second row of the element selected in .
As you use the and menus to select a table data element, the remaining sections of the page will change show the data format settings corresponding to the selections.
Specify Transformation and Frequency Conversion
Once you used to select a data table element to customize, you may use the section of the page to transform the data prior to display, and if relevant, to select a frequency conversion method to use.
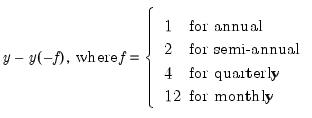
Transformation Method
The menu offers quick access to the most commonly employed transformations:
Level (no transformation) | No transformation |
1 Period Difference | |
1 Year Difference | |
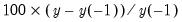
1 Period % Change | |
1 Period % Change at Annual Rate | Computes  such that: where  is defined above and  is the 1 period% change. |
1 Year % Change | 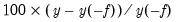 , where  is defined above. |
In addition, if the setting for is set to , the dropdown will also offer the choice of so that you may eliminate the second row display entirely.
We emphasize that the transformation menu includes only the methods most commonly employed in constructing tables. If you wish to display the data with other transformations, you may always add an appropriate auto-series to the original group.
Frequency Conversion
The menu allows you to select the desired frequency conversion for the specified data:
Average then Transform | First convert by taking the average, then transform the average. |
Transform then Average | First transform the series, then take the average of the transformed series. |
Sum then Transform | First convert by taking the sum, then transform the sum. |
First Period | Convert by taking the first quarter of each year or first month of each quarter/year. |
Last Period | Convert by taking the last quarter of each year or last month of each quarter/year. |
The choice between Average then Transform and Transform then Average changes the ordering of the transformation and frequency conversion operations. The methods produce different results only for the nonlinear “% change” methods.
Set Data Labeling and Formatting
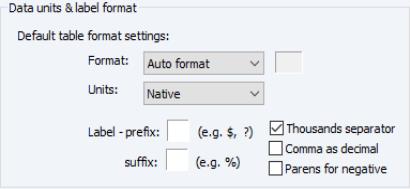
EViews lets you control formatting of the display of the selected table element using the controls in the Data units & label format section.
If you are modifying the table defaults, the dialog allows you to define the default settings for all of the series in the group:
As you can see, you may specify format, units, label, separator and delimiter settings. Changes in settings for the table default will affect formatting for all rows in the table which employ the defaults.
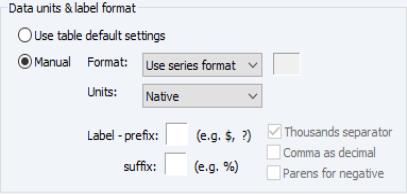
If you are modifying settings for an individual series row, the dialog changes to display radio buttons offering the option of using the default settings (), or overriding the default with series specific () formatting:
If you select , you will be prompted to specify format, units, label, separator and delimiter settings.
For both table default and individual series row settings, the basic numerical display format may be set using the Format dropdown. The basic format options are:
Auto format | EViews chooses the format depending on the data. |
Fixed decimal | Specify how many digits to display after the decimal point. This option aligns all numbers at the decimal point. |
Fixed chars | Specify how many total characters to display for each number. |
Generally, the default auto formatting will produce appropriate output formatting, but if not, simply select the desired fixed decimal or character method and enter the appropriate integer value in the edit field.
You may also specify the in which to display your data. The menu allows you to choose between the default , and , , , , ).
If you select an entry other than Native, EViews will transform the data into the units selected. For example, if you have a data point containing the value 1234567, setting the units to thousands changes the display of that data point to 1234.567, and setting the units to millions changes displays 1.234567. Again this change in units is for display purposes only and does not alter the underlying data.
Note that EViews will round and transform your data prior to display in order to fit the specified format. We emphasize, however, that this data adjustment is for display purposes and does not alter the original data.
The remaining settings allow you to assign a custom label prefix or suffix to the number (i.e., a currency or percentage symbol), to specify the separator to denote thousands and decimals (comma or period), and to determine whether to use surrounding parentheses to indicate negative numbers.
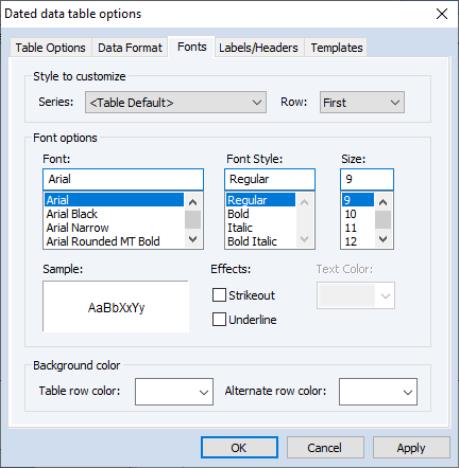
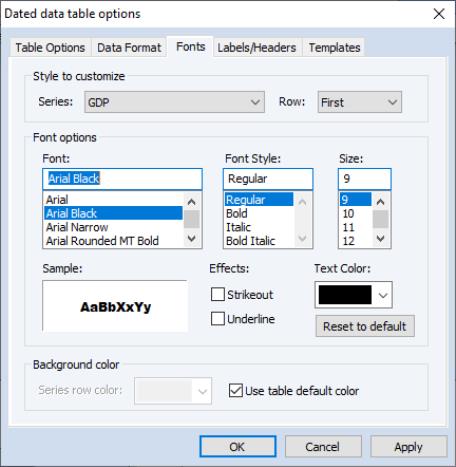
Font Settings
The Fonts tab of the dated data table dialog lets you change the font styles used in the table.
As in the tab, the top portion of the dialog is used to select the element or elements to customize. The dropdown allows you to set the table default or change the font of a specific series in the table. If you chose to have two rows of data per series on the Data Format tab, the dropdown lets you choose whether to change the data format settings for the first display row, for the second display row, or for the custom header.
The Font options section of the dialog may be used to change the text format of the selected table elements. You should use the settings to specify the font type, style, size, color, and effects of the element selected at the top of the dialog.
If you are modifying the fonts of an individual series, the section will contain a button in the bottom right-hand corner. The button will be enabled if the current settings differ from the table defaults. Clicking on the button clears the individual modifications.
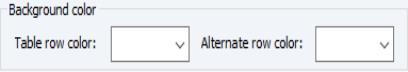
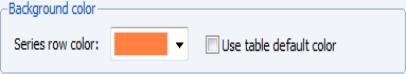
The Background color area allows you to assign background color highlighting to rows in your table:
• If you are modifying the table defaults, the Background color area will contain two color selectors labeled Table row color and Alternate row color (note that these settings are not row-specific so they do not depend on the selected row). By default, both selectors are set to the color white. To change the color, simply click on the color to bring up the picker dialog and choose the desired color.
Modifying the Table row color will change the color of the odd numbered rows in your table. Changing the Alternate row color dropdown will change the color in the even numbered rows of the table.
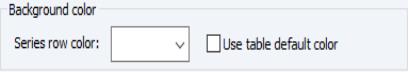
• If you are modifying the settings for an individual series, the Background color area will display settings for the specific series row.
By default, the checkbox is selected. Unselecting this option enables the option. To change the series background color, click on the color box to bring up the picker and make your selection. Note that you may select the option to restore the series color to the default table setting.
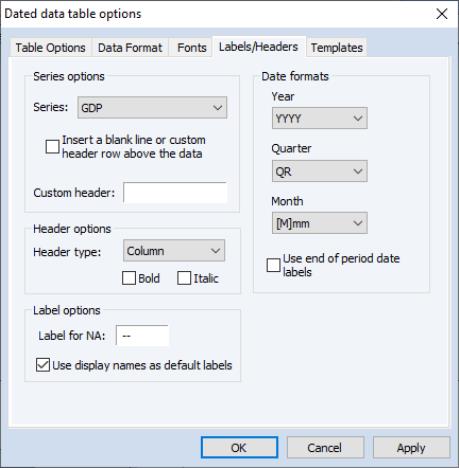
Labels and Headers
You may use the tab to add custom series headers, apply italic or bold formatting to the column (variable) and row (date label) headers, set date formatting, and specify the text to represent missing values:
• The section allows you to insert a blank line or custom header for a data series. If you set this option, EViews will insert a header row above each row of data for the specified series.
You may select the desired series in the drop-down and check the box.
You may enter the custom header text in the edit field, or leave the field blank. The custom header text may also be edited directly in the dated data table by clicking on the button on the table button bar and entering text in a blank header cell.
• You may use the section to add bold or italic formatting to the row or column headers. Simple select or in the drop-down menu and check the and checkboxes as desired to apply formatting.
• The section offers controls for value and series labeling.
The edit field contains the text representation for missing values in the dated data table. You may replace the default “--” with the desired characters.
If your series has display names, you may use the display name as the label for the series by selecting the
Use display names as default labels option. (See
“Naming Objects” and
“Labeling Objects” for discussion of display names and the label view.)
• The Date formats section controls the representation of dates in the table output. You may use the three drop-down menus to set the format used for representing , and . You can also specify whether date periods will be labeled using the last date of the period rather than the first date of the period by selecting the Use end of period date labels check box.
Editing a Dated Data Table
Along with customizing your dated data table using the options dialog, you may edit the individual cells of the table, add a title, or change the sample of observations used to construct the table.
To edit individual cells, you must first click on the button in the group toolbar to toggle edit mode. You may then edit series (row) labels, custom headers, and data values in the table.
It is important to note that
if you edit a data cell, the underlying series data will change. This is an important feature allows you to use dated data tables for data entry. Moreover, editing transformed data will modify the original series data in an appropriate fashion. Thus, you may edit data in period differences or one-year percent changes or any other supported transformation method (see
“Transformation Method”), and have the original data change to match your edits in the transformed data.
Note however, that any changes that you make to row labels will not apply to the underlying series, only to the dated data table view.
Lastly, the dated data table view offers two toolbar buttons which allow for quick modification of the table:
• allows you to add a title to the table
• allows you to change the sample used to construct the table
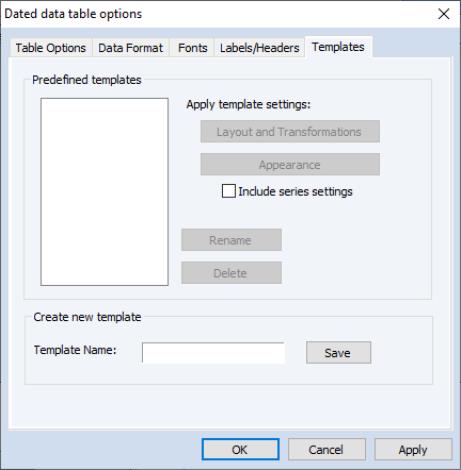
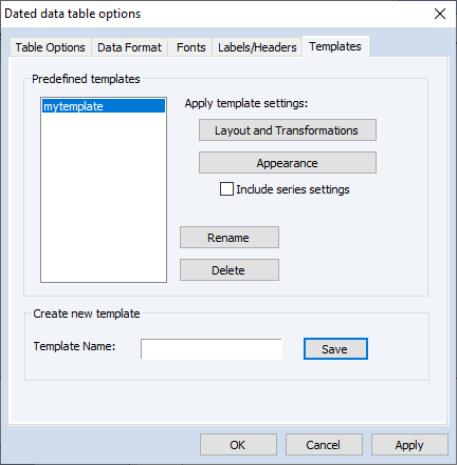
Dated Data Table Templates
You may store and load all of your dated data table settings using dated data templates.
To create a template from an existing dated data table, click on , then select the tab.
In the bottom portion of the dialog page you will see a edit field. Enter a valid EViews name for the template, and click on .
To apply the template to a dated data table, open the group and display the dated data table. Click on the , select the tab, then select the template you wish to use.
Clicking on the and button updates the current dated data table settings to match those of the template.
• The correspond to the basic table layout options including the frequency specifications and other options found on the tab, along with the table default row transformations.
• The button updates the data label formatting, fonts, and labels and headers.
• You should use the checkbox in conjunction with the update buttons if you wish to import the series specific data format, font, or custom header overrides.
You may use the and the button to manage your existing templates.
An Illustration
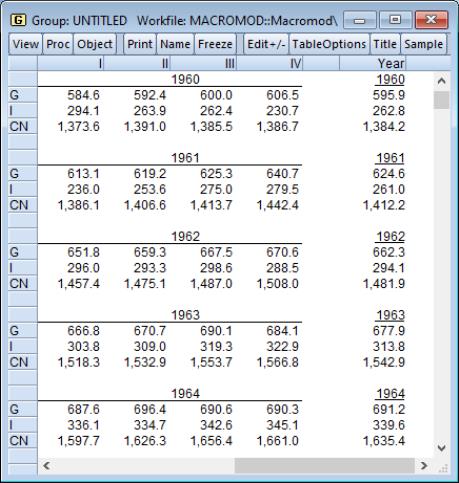
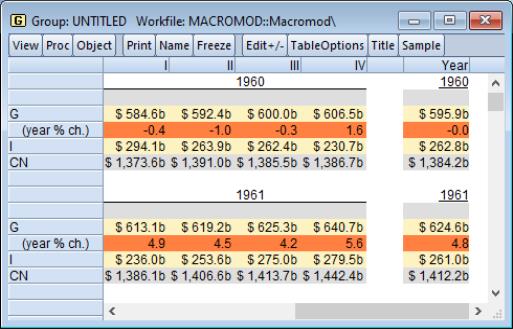
As an illustration of these settings we use the “Macromod.wf1” workfile containing US macro economic data. We set the workfile sample to “1960 2005” and open a group containing the series G, the series I, and the series CN.
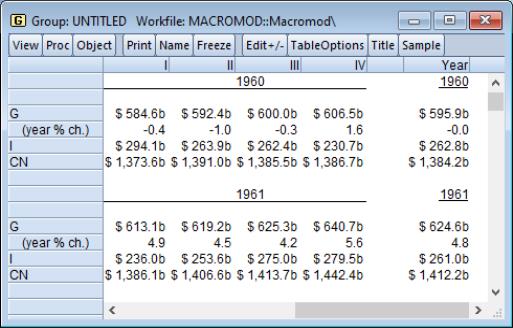
By default the dated-data table view for this group looks like the following:
The first column grouping shows quarterly data for each series for each year. The second grouping shows an annual summary. Each series has a single line of data per year.
We will use the dated data table options dialog to customize this table. First, click on the button, go to tab, and change the table default to have “$” as the prefix and “b” (for billions) as the suffix:
Next, we specify a second row with transformation for the G series. Specify the data table element to modify by selecting and in the , and set the drop-down menu to 1 Year % Change with set to Average then Transform:
Note that transformation for the first row of G should still be set to the table default.
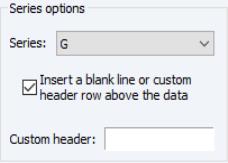
Lastly, to display a blank header line above every row of the G series, click on the tab, select the checkbox, and leave the edit field blank.
Click on to accept the changes. The modified dated data table now looks as follows:
Notice the prefix and suffixes which have been added to the data values for all of the series, and the extra header line separating the year headers and the data for the G series.
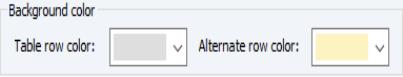
We will make two final changes. First, click on the button and go to the tab. With the drop-down set to “<Table default>”, we may set the field to show a gray and the to yellow.
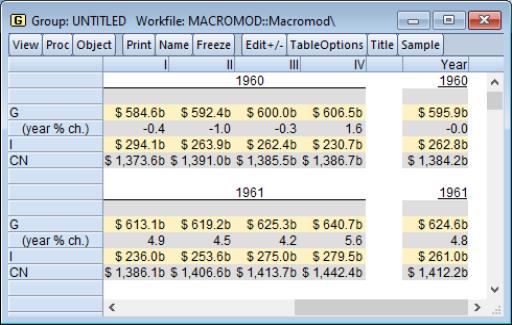
Clicking on yields the following table:
in which odd rows have a gray background and even rows have a yellow background.
Lastly, we override the default background color settings for the G series. Click on the tab in the options dialog and select “G” and in the and drop-down menus.
Deselect the Use table default color checkbox and select a color using the Series row color picker. Here we have elected to color the annual percentage change row of our Government spending series (G) in orange.
Click on to accept the changes. Our final table is depicted below: