Group Procedures Overview
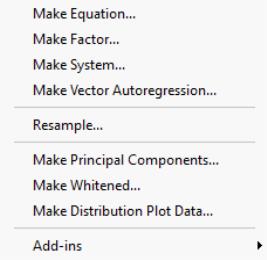
There are several procedures available for groups which generate new objects or data.
Make Equation
The proc opens an dialog box with the first series in the group listed as the dependent variable and the remaining series as the regressors, including a constant term “C”. You can modify the specification as desired. See
“Basic Regression Analysis” for details.
Make Factor
opens the factor analysis dialog with the correlation specification filled out with the series in the group. See
“Factor Analysis” for details.
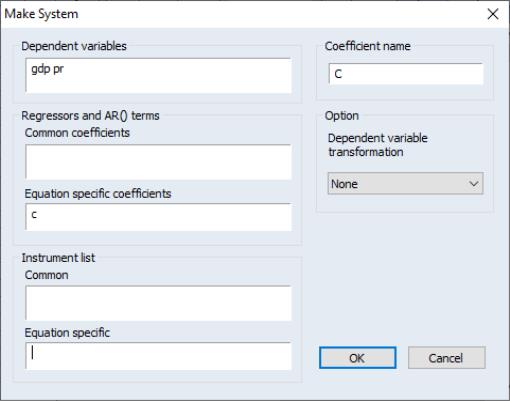
Make System
You may use theproc to make a system object. Simply select to open a system specification dialog. The dialog will be filled with the series in the group as dependent variables, and has edit fields that allow you to list common and equation specific regressors, instruments, and dependent variable transformations, if desired.
Make Vector Autoregression
opens an dialog box, where all series in the group are listed as endogenous variables in the VAR. See
“Vector Autoregression (VAR) Models” for a discussion of specifying and estimating VARs in EViews.
Resample
performs resampling on all of the series in the group. A description of the resampling procedure is provided in
“Resample”.
Make Principal Components
is used to save various intermediate results from principal components analysis. See
“Saving Component Scores”.
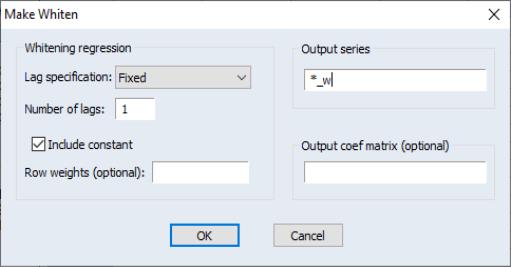
Make Whitened
You may use the procedure from a group (or series) to use the results from a parametric VAR (or AR) model to filter the data. EViews offers whitening based on either a fixed lag specification, or an information criterion based auto-selected lag.
You may use the dropdown to choose between a , user-specified number of lags on the VAR, or you may choose automatic lag-selection by choosing , , or . In the case, EViews will prompt you for the number of lags to use; in the automatic selection case, you will be prompted for the maximum number of lags to use in selection. The default setting of “*” indicates use of an observation based maximum lag of

as suggested by Den Haan and Levin (1997).
You may use the checkbox to indicate whether to include a constant in the VAR, and you may specify in the corresponding edit field.
By default, EViews will save the results in series with the names given by those in the group with “_W” appended to the end. Information on the whitening procedure will be included in the series label. If you would like to change the names, you can provide a list of series names or an alternate wildcard expression in the edit field.
Lastly, you can instruct EViews to save a matrix containing the estimated coefficients from the VAR by entering a valid object name in the edit field. The results will be saved in a matrix where each column represents the coefficients for the corresponding series in the group. The coefficients are ordered in the column by: constant (if present) followed by the lag 1 coefficient for each of the series in the group, in order, followed by the lag 2 coefficients, etc.
To illustrate the use of this tool, we use the data for industrial production (IP), money supply (M1), and the Treasury bill rate (TB3) in the workfile “Var1.WF1” used in
“Vector Autoregression (VAR) Models”. First set the sample to the entire workfile by entering the command
smpl @all
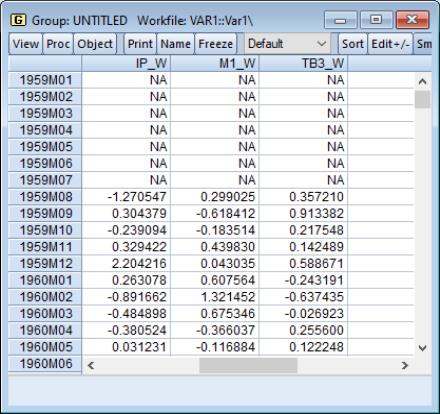
Next, create a group containing IP, M1, and TB3, name the group GROUP01, then click on . to display the whitening dialog. Set the dropdown to , and enter “ABC” in the edit field. Click on .
EViews displays a new untitled group containing the three whitened series IP_W, M1_W and TB3_W. In addition, the

matrix object ABC contains the coefficients for the 7 lag VAR used to filter the data.
Note that the handling of lags differs slightly between the whitening procedure and VAR estimation. The whitening procedure does not use lagged values prior to the beginning of the computation sample, while the VAR estimator will use any available lags, even if they precede the estimation sample. In this case, the results for the whitening procedure will exactly match those of a VAR estimated for the sample from 1959M01 to 1995M04 since there are no valid presample values, but this correspondence may not hold for samples starting after the beginning of the workfile.
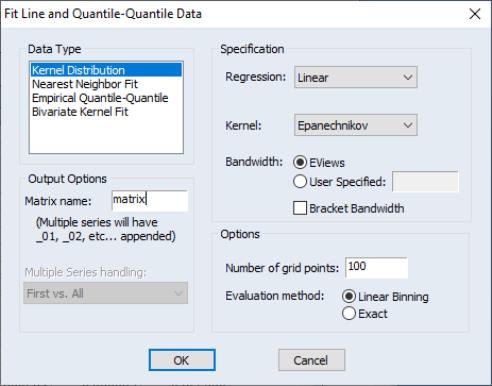
Make Distribution Plot Data
may be used to output the graph data used to construct auxiliary kernel, nearest neighbor, and quantile-quantile graphs. See
“Auxiliary Graph Types”.
Simply select the desired graph type on the upper-left hand side of the dialog, set the relevant options on the right, choose a base name for the output, and if necessary, specify how to handle multiple sets of series in the group.