LogL Specific Views and Procedures
Most of the views and procedures of the logl object should be familiar to you from other EViews estimation objects. We describe here features that are specific to the logl object.
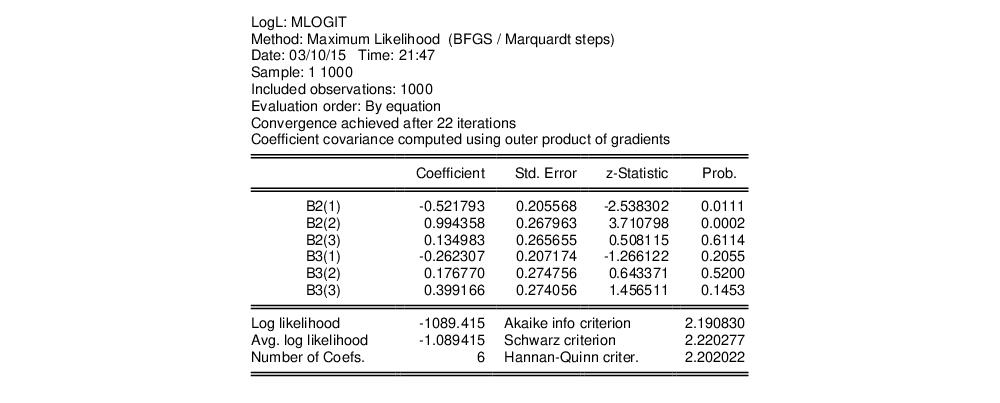
Estimation Output
In addition to the coefficient and standard error estimates, the standard output for the logl object describes the method of estimation, sample used in estimation, date and time that the logl was estimated, evaluation order, information about the convergence of the estimation procedure, and the method used to compute the coefficient covariance matrix.
EViews also provides the log likelihood value, average log likelihood value, number of coefficients, and three Information Criteria. By default, the starting values are not displayed. Here, we have used the dialog to instruct EViews to display the estimation starting values in the output.
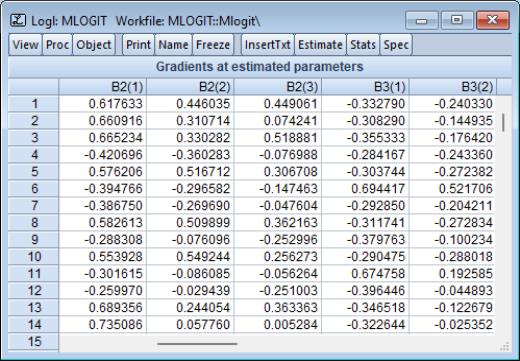
Gradients
The gradient summary table and gradient summary graph view allow you to examine the gradients of the likelihood. These gradients are computed at the current parameter values (if the model has not yet been estimated), or at the converged parameter values (if the model has been estimated). See
Appendix D. “Gradients and Derivatives” for additional details.
You may find this view to be a useful diagnostic tool when experiencing problems with convergence or singularity. One common problem leading to singular matrices is a zero derivative for a parameter due to an incorrectly specified likelihood, poor starting values, or a lack of model identification. See the discussion below for further details.
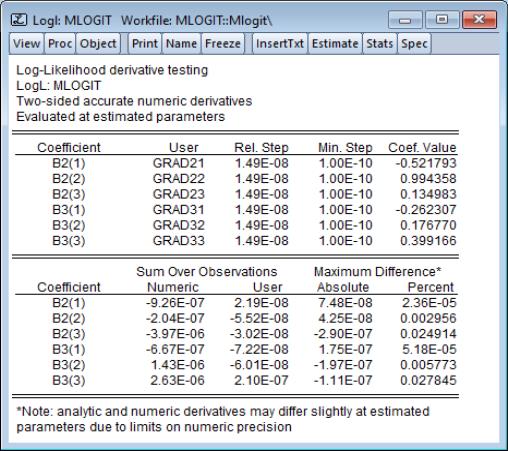
Check Derivatives
You can use the view to examine your numeric derivatives or to check the validity of your expressions for the analytic derivatives. If the logl specification contains a @param statement, the derivatives will be evaluated at the specified values, otherwise, the derivatives will be computed at the current coefficient values.
Consider the derivative view for coefficients estimated using the logl specification. The first part of this view displays the names of the user supplied derivatives, step size parameters, and the coefficient values at which the derivatives are evaluated. The relative and minimum step sizes shown in this example are the default settings.
The second part of the view computes the sum (over all individuals in the sample) of the numeric and, if applicable, the analytic derivatives for each coefficient. If appropriate, EViews will also compute the largest individual difference between the analytic and the numeric derivatives in both absolute, and percentage terms.