Estimating a Mixed Frequency VAR in EViews
Although a single EViews workfile page can contain only one frequency of data, workfiles support multiple frequencies by allowing multiple pages. To estimate a mixed frequency VAR (MFVAR) in EViews, your workfile must be setup with different frequency data on different pages.
To estimate a MFVAR in EViews, select the page with the lowest frequency data, and click on or type var in the command window to bring up the dialog. Select as the in the drop-down box on the left-hand side of the dialog.
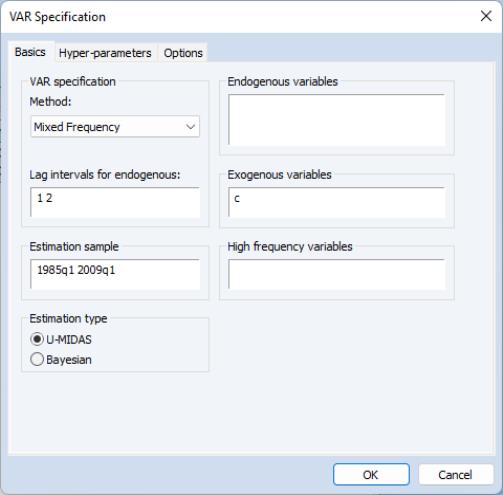
The dialog will change to the MFVAR version of the VAR Specification dialog. As with a standard VAR, you may use the page to list of endogenous variables, the included lags, and any exogenous variables, and to specify the estimation sample:
Note that the and boxes should be used to enter the names of the series that are located on the current lowest frequency page. EViews does not allow for exogenous variables in a differing frequency.
The edit field is used to specify the higher-frequency endogenous variables. The syntax for high frequency variables is pagename\seriesname where pagename is the name of the page containing the series, and seriesname is the name of the series. Note also that series expressions are allowed, e.g. “mypage\log(x)”.
The radio buttons change the estimation type between simple U-MIDAS and Bayesian estimation.
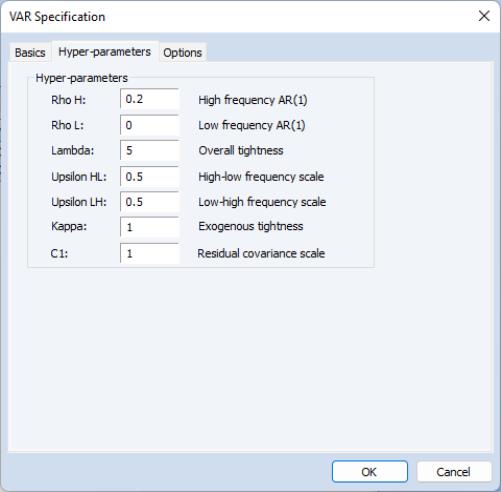
Hyper-parameters
If is selected as the , the page of the dialog allows specification of the hyper-parameters used during estimation:
Options
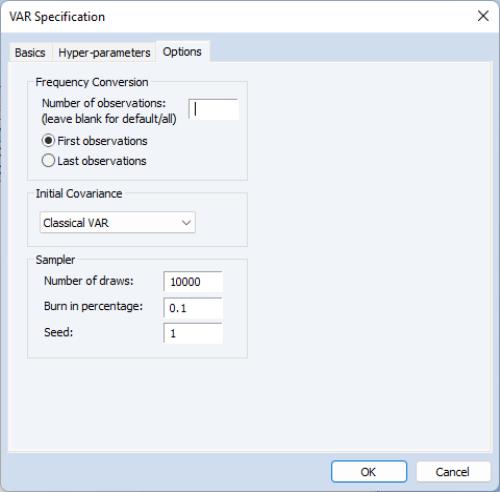
The page offers options on the frequency conversion method used, as well as options for the sampler used during mixed frequency estimation:
The field in the box specifies the number of high frequency observations to use for each low frequency period. For example, when dealing with monthly and quarterly data, the field can be used to specify that only two months out of each quarter should be used, rather than all three. Note that in contrast to univariate MIDAS estimation, mixed frequency VAR estimation does not allow specification of high frequency observations that fall outside of the corresponding low frequency period.
If the field is left blank, EViews will use the minimum number of high-frequency observations per low frequency period. For monthly to quarterly data this will be three. For seven-day daily to monthly, this will be 28 (if the monthly data cover a non-leap year February). Care should be taken if choosing to increase the value to 30 or 31, since for a number of months the observation will be NA, and that NA will be propagated multiple times due to the lag nature of the VAR, resulting in a large number of observations being dropped from estimation.
The and radio boxes specify whether to use the first set of high-frequency observations from each low frequency period, or the last. For example, with monthly and quarterly data, if two observations are being used, these radio buttons select whether the first two months in the quarter are used or the last two months.
The and boxes are only available if was selected as the on the tab.
specifies the initial estimate of the residual covariance matrix used for formulation of the prior. Either the covariance matrix from a U-MIDAS classical VAR can be used, or an identity matrix.
specifies the number of draws of the Gibbs’ Sampler, the percentage of draws to discard as burn-in, and the random number seed.
Post Estimation Procedures
Although can be used for mixed-frequency VARs, it should be noted that only forecasts for the low-frequency variables will be produced.
If the mixed-frequency VAR is estimated using Bayesian methods, the and menu items will offer the Bayesian form of these procedures as outlined in
“Bayesian VAR Models”.


