By-Statistics
While not specifically panel aware, there are a variety of places in EViews where you may use a classification variable to compute statistics by-group. In these cases, you may use the @crossid identifier to compute statistics for each cross-section.
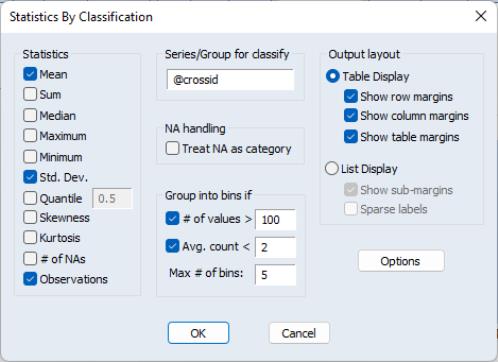
For example, you may open a series object and select to display summary statistics for various groups:
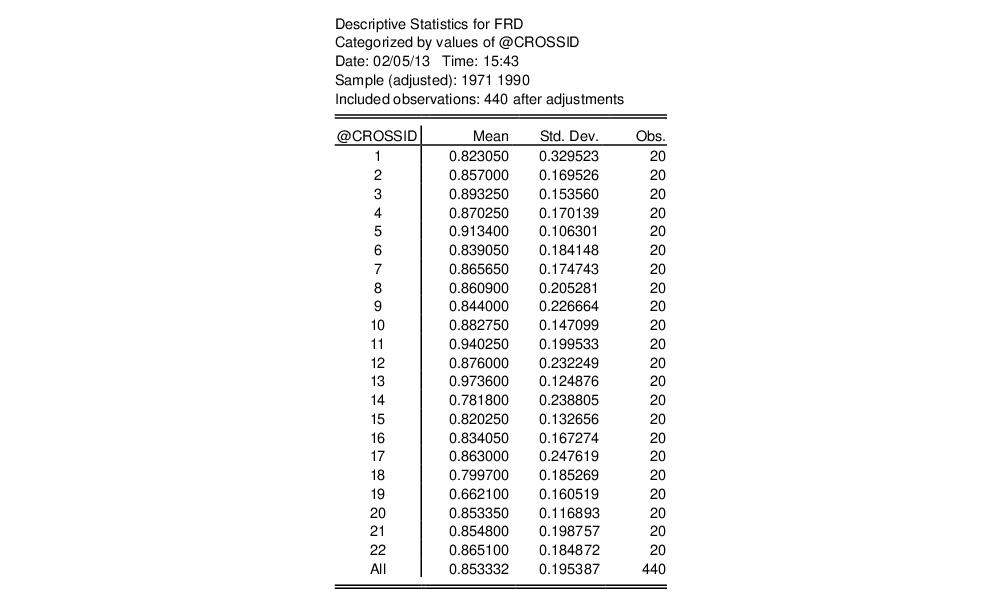
Enter @crossid to compute statistics by cross-section:
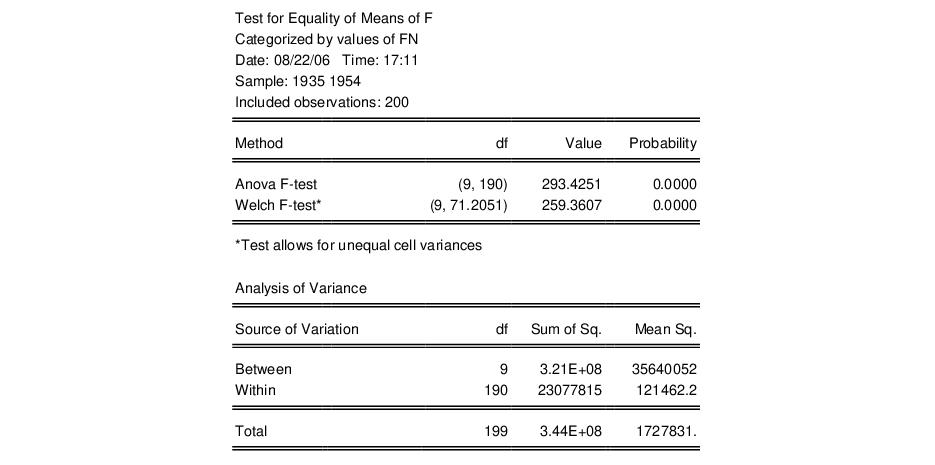
Similarly, you may test equality of means across cross-sections (). Simply open the series, then select . Enter FN in the edit field, and select to continue. EViews will compute and display the results for an ANOVA for F, classifying the data by firm ID. The top portion of the ANOVA results is given by:
Note in this example that we have relatively few cross-sections with moderate numbers of observations in each firm. Data with very large numbers of group identifiers and few observations are not recommended for this type of testing. To test equality of means between periods, call up the dialog and enter either YEAR or DATEID as the series by which you will classify.
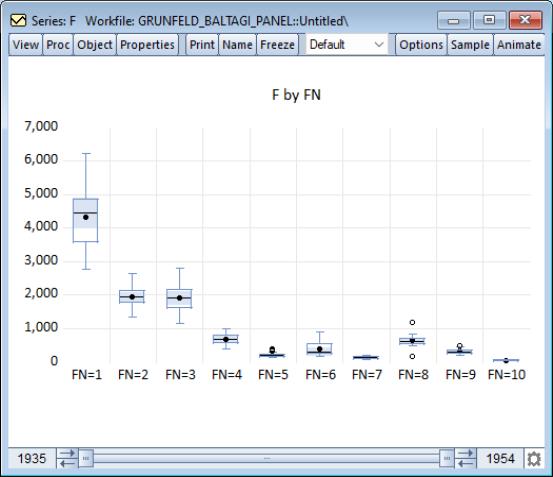
A graphical summary of the primary information in the ANOVA may be obtained by displaying boxplots by cross-section or period. For moderate numbers of distinct classifier values, the graphical display may prove informative. to bring up the Graph Options dialog. Select Categorical graph from the drop down on the top left, select Boxplot from the list of graph types, and enter FN in the edit field. Click to display the boxplots using the default settings.
One particularly useful set of non-panel specific tools that may be used for panel analysis are the by-group statistics functions (
“By-Group Statistics”). The by-group statistics allow you to compute statistics by cross-section ID and match merge those results back to the original data. For example the simple expression
series ydemean = y - @meansby(y, @crossid)
computes the deviations from the cross-section means for the series Y and places the results in the series YDEMEAN.