Panel Unit Root Testing
EViews provides convenient tools for computing panel unit root tests both under the assumption of cross-section independence and allowing for cross-section dependence.
EViews computes five different independent cross-section panel unit root tests: Levin, Lin and Chu (2002), Breitung (2000), Im, Pesaran and Shin (2003), Fisher-type tests using ADF and PP tests (Maddala and Wu (1999) and Choi (2001)), and Hadri (2000).
EViews currently supports two important dependent cross-section tests: Bai and Ng’s (2004) Panel Analysis of Nonstationarity in Idiosyncratic and Common Components (PANIC), and Pesaran’s (2007) Cross-sectionally Augmented IPS (CIPS).
To compute the independent unit root test on a series, simply select from the menu of a series object.
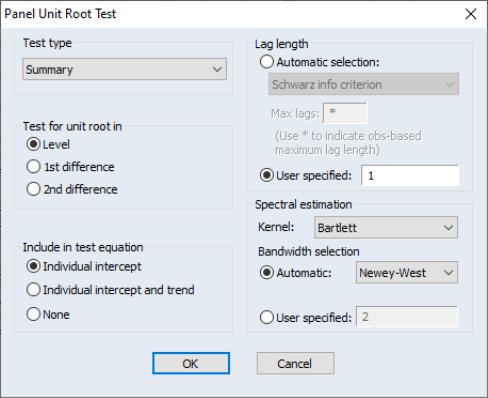
By default, EViews will compute a of all of the first five unit root tests, where applicable, but you may use the dropdown menu in the upper left hand corner to select an individual test statistic.
In addition, you may use the dialog to specify trend and intercept settings, to specify lag length selection, and to provide details on the spectral estimation used in computing the test statistic or statistics.
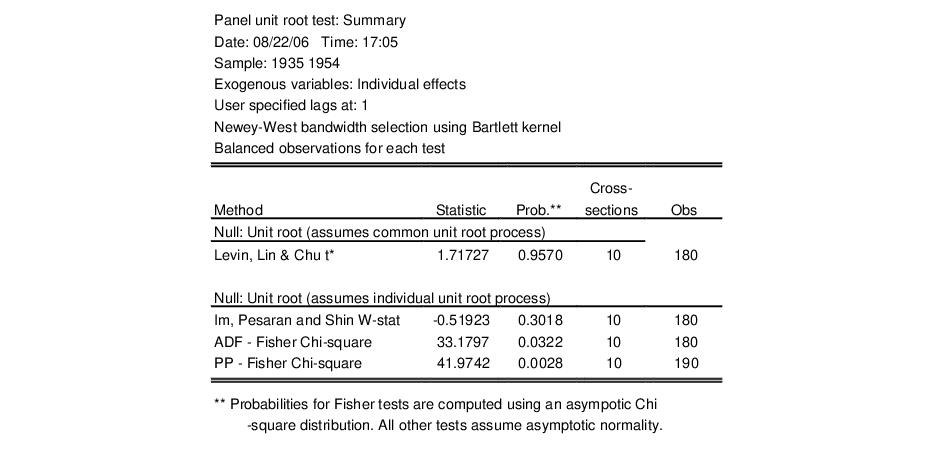
To begin, we open the F series in our example panel workfile, and accept the defaults to compute the summary of several unit root tests on the level of F. The results are given by
Note that there is a fair amount of disagreement in these results as to whether F has a unit root, even within tests that evaluate the same null hypothesis (e.g., Im, Pesaran and Shin vs. the Fisher ADF and PP tests).
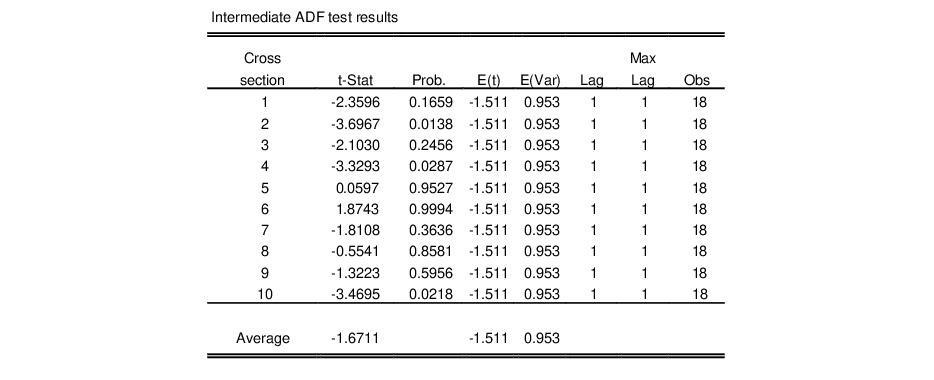
To obtain additional information about intermediate results, we may rerun the panel unit root procedure, this time choosing a specific test statistic. Computing the results for the IPS test, for example, displays (in addition to the previous IPS results) ADF test statistic results for each cross-section in the panel:
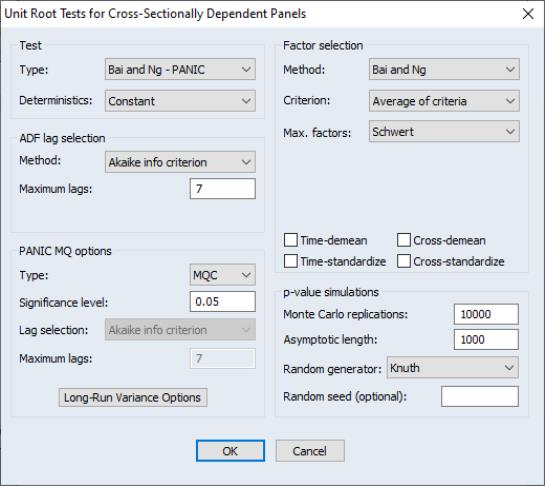
To compute a dependent unit root test on a series, simply select from the menu of a series object:
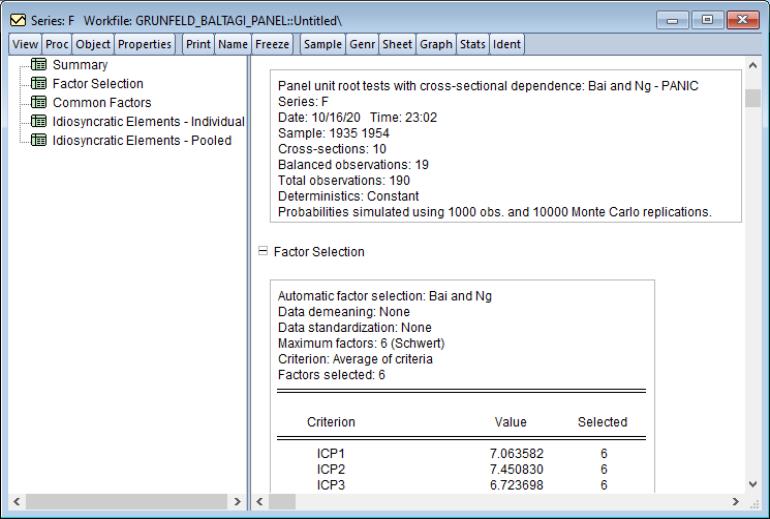
For the default PANIC options, we have the results
The results are displayed in a spool. For a discussion of the results, additional examples, and discussion, see
“Cross-sectionally Dependent Panel Unit Root Tests”.
