Panel Workfile Display
The two most prominent visual changes in a panel structured workfile are the change in the range and sample information display at the top of the workfile window, and the change in the labels used to identify individual observations.
Range and Sample
The first visual change in a panel structured workfile is in the and descriptions at the top of workfile window.
For a dated panel workfile, EViews will list both the earliest and latest observed dates, the number of cross-sections, and the total number of unique observations. Here we see the top portion of an annual workfile with observations from 1935 to 1954 for 10 cross-sections. Note that workfile sample is described using the earliest and latest observed annual frequency dates (“1935 1954”).
In contrast, an undated panel workfile will display an observation range of 1 to the total number of observations. The panel dimension statement will indicate the largest number of observations in a cross-section and the number of cross-sections. Here, we have 92 cross-sections containing up to 30 observations, for a total of 506 observations. Note that the workfile sample is described using the raw observation numbers (“1 506”) since there is no notion of a date pair in undated panels.
You may, at any time, click on the display line or select to bring up the dialog so that you may modify or remove your panel structure.
Observation Labels
The left-hand side of every workfile contains observation labels that identify each observation. In a simple unstructured workfile, these labels are simply the integers from 1 to the total number of observations in the workfile. For dated, non-panel workfiles, these labels are representations of the unique dates associated with each observation. For example, in an annual workfile ranging from 1935 to 1950, the observation labels are of the form “1935”, “1936”, etc.
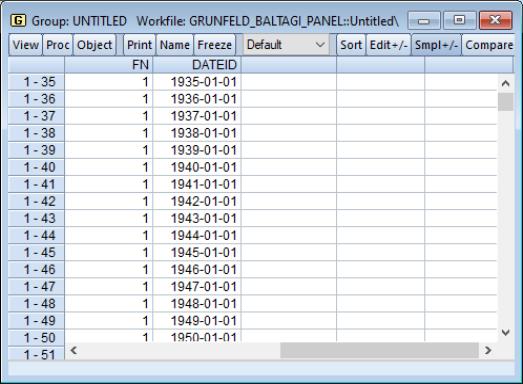
The observation labels in a panel workfile must reflect the fact that observations possess both cross-section and within-cross-section identifiers. Accordingly, EViews will form observation identifiers using both the cross-section and the cell ID values.
Here, we see the observation labels in an annual panel workfile formed using the cross-section identifiers and a two-digit year identifier.


