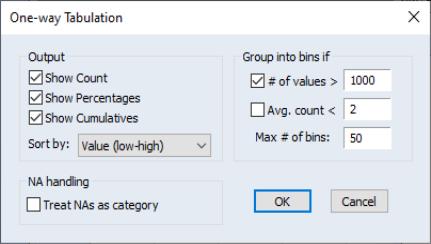
The options control which statistics to display in the table and how to display the results. By default, the results are sorted by-value, from low to high, but you may use the dropdown to sort from high to l ow, or by-frequency. You should specify the NA handling and the grouping options as described above in the discussion of
“Stats by Classification”.
Cross-tabulation (

-way tabulation) is also available as a group view. See
“N-Way Tabulation” for details.