Customizing the Spool
The spool object provides several options for customizing the display of object elements in the spool.
Display Properties
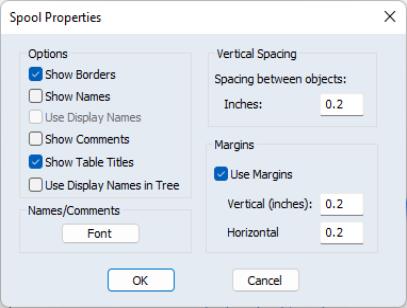
Press the button in the tool bar to bring up the dialog which allows you to set the basic display properties for the spool object:
General Settings
The section of the dialog allows you to show and hide various parts of the spool.
• The
Show Borders option allows you to display a frame around each of the output objects in the main spool window. Dragging the border of an object will resize that object (see
“Resizing Objects”).
• The and checkboxes control the display of names in the main output window. Object name labels for each object are displayed if is checked; the display names are used in place of the object name if is checked (see
“Naming Objects”).
• The checkbox of this dialog determines whether individual object comments are displayed (see
“Adding Comments”).
• controls whether to display the table objects using their own titles.
Note that the , and settings may be accessed directly from the spool object toolbar. For example, clicking on the button is the same as checking or unchecking the corresponding box in the dialog.
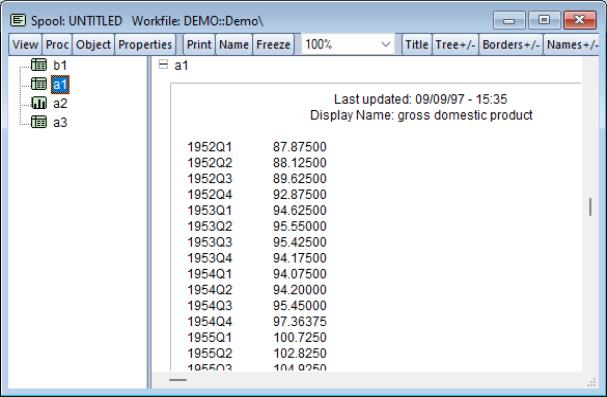
The last option, , requires some discussion. In EViews, table objects have titles which generally differ from the name given the table in the spool. When Show Table Titles is checked (the default), the title of each table will be displayed. If we also turn on Show Names, we see that the object name in the spool is “A1” and the table title is “GDP”:
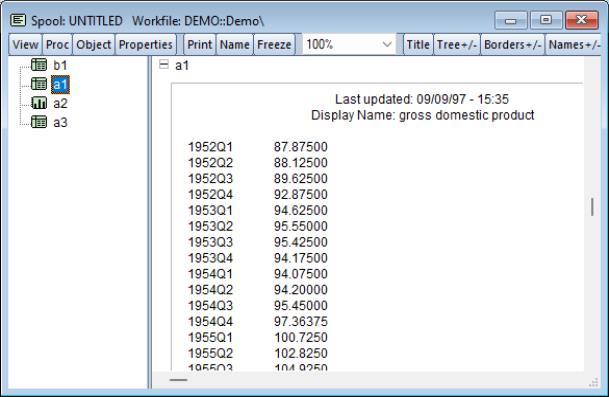
Next, we turn table titles off, which hides the “GDP” table title. Note here that the first line of the object display is now the update date:
Names/Comments Font
Click on the button to bring up a dialog for setting the font size, color, and family for text in displayed names and comments.
Vertical Spacing
The edit field controls the amount of vertical space placed between output objects in the spool.
Margins
The checkbox controls whether the spool will display the contents of the output window with vertical and horizontal margin padding. If you wish to provide spool margins, you should select this option and enter values for the size of the vertical and/or horizontal margins.
Note that this setting controls margins for the spool object itself. Margins for individual objects may be adjusted by selecting an object, right mouse clicking, and selecting (see
“Indenting Objects”). Individual object margins are specified relative to the margins for the spool object.
Display Modes
When you bring an output object into a spool, EViews copies the original output object at its original size; we term this the native object size. Subsequent editing of the object in the spool may change this native size (see
“Editing Objects in a Spool”).
The spool object allows you to display objects at sizes that differ from the native sizes. By separating the display size of the object in the spool from the native object size, EViews permits customizing the display of objects without requiring manual editing of the native size in each output object.
By default, EViews displays graph objects in a spool using a uniform width while table and text objects are displayed in using their native widths and font sizes. This default setting allows for a relatively uniform appearance for the objects in the spool.
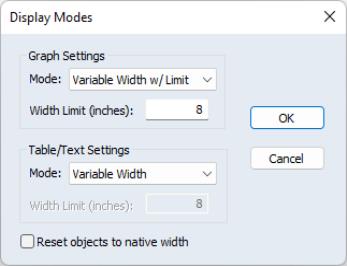
You may alter the display settings for the spool to allow graphs and tables to be displayed at different sizes. Click on to bring up the dialog.
The top portion of the dialog offers that control the display size of graph objects in the spool. The dropdown menu allows you to choose between various settings:
• The default setting fixes the spool display sizes for graphs at a uniform width, as specified in the edit field.
• displays the graphs at the native sizes, but permits individual customization as described in
“Resizing Objects”.
• displays graph objects in their native widths so long as they do not exceed the specified limit, otherwise the display size is adjusted accordingly. You may customize the display sizes of individual objects.
The portion of the dialog provides similar control over tables and text objects (though is not available for tables). For table and text objects, the default is to use Variable Width, but you may use the dropdown to change the settings to Variable Width with limit. If a table or text object is resized, the font will be scaled accordingly.
You may, after performing individual display sizing (
“Resizing Objects”) decide that you wish to revert to the original native sizes; selecting , and clicking on will set all of the objects in the spool to use their native sizes.