Post-Estimation Results
As with single equation switching estimation, EViews allows you to compute one-step ahead predicted, filtered, and smoothed estimates of the regime probabilities and to display graphs and tables of these results.
Additionally, many, but not all of the standard VAR views are available.
Switching Views
Once you have estimated your VAR, EViews offers a variety of views for examining your results.
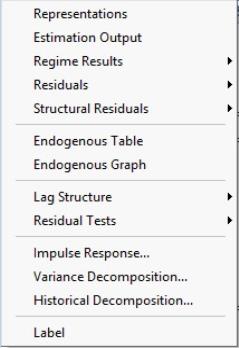
Most of these routines are familiar tools for working with an estimated VAR. You may, for example, examine orviews for your estimated VAR, examine the or views or examine the of your VAR.
Since the presence of multiple regimes creates a few wrinkles, we offer a few comments on select views.
Regime Results
EViews offers specialized tools for examining the regime transition results and predicted regime probabilities.
Transition Results
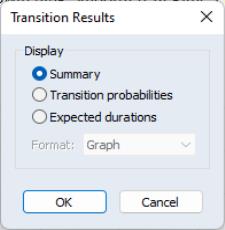
To display the transition results dialog, select EViews offers to display different types of output: , , and .
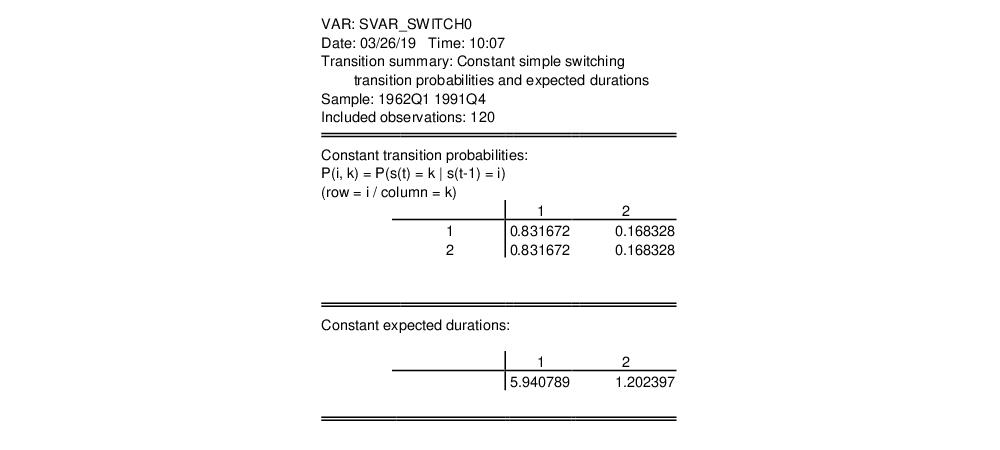
The default display shows a table containing both the transition matrix and the expected durations (Kim and Nelson, 1999, p. 71-72) implied by the transition matrix. For example:
Here, we see results from a simple switching model with constant transition probabilities. Note that since the model assumes simple switching, the probabilities of being in regime 1 and regime 2 (approximately 0.83 and 0.17, respectively) do not depend on the origin state. These probabilities imply that the expected duration in a regime is roughly 5.9 quarters in regime 1 and 1.2 quarters in regime 2.
In models with varying transition probabilities, the transition probability summary will instead show the means and standard deviations of the transition probabilities and the expected durations.
The latter two output type choices may prove useful in models with time-varying transition probabilities:
• Selecting allows you to see the transition matrix in every period. You will be offered a choice of displaying the transition probabilities in (default), , or form.
The display shows a multiple graph showing each transition probability. For purposes of this display simple switching models are treated as restricted Markov switching models. Thus, a two-regime switching model will always show four separate graphs, one for each transition. Note that for constant transition probability models, each graph will be a straight line.
The display shows the same results in spreadsheet format while the form displays results for each period in a table form similar to that used in the summary display. For constant probability models, the spreadsheet format will contain identical rows and the table form will show a single transition matrix.
• Lastly, you may display the associated with the transition matrix in each period. The results may be displayed in (default), , or form. For constant probability models, the table form will only show the single set of expected durations.
Regime Probabilities
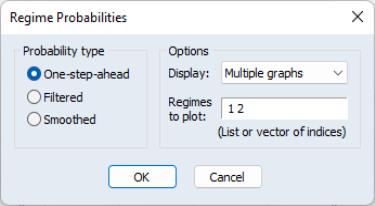
To display the estimated regime probabilities select
EViews offers a choice between the , , and probabilities. For simple switching models without AR terms, the filtered and smoothed results are the same. In addition, you may display the results in , in a , or in form.
For graphical output you may also select which regimes to plot by entering the corresponding indices in the edit field. While the default is to show the probabilities for all regimes, you may use the edit field to remove redundant probabilities or to focus on a specific regime of interest.
Other Views
The lag structure and the error structure of the VAR play a central role in a number of VAR views (lag structure, impulse response, variance decomposition, historical decomposition).
In cases where the dynamic coefficients and the error covariance matrix are regime independent, these views will produce results identical to those obtained in a standard VAR setting.
In cases where there are regime specific values, EViews will compute each set of regime specific results. For example, if there are regime specific VAR lag coefficients, EViews will display lag structure results or produce impulse responses for each regime.
Switching Procs
EViews offers several procs for working with switching VARs. Most of these procs are self-explanatory, but we offer brief comments about saving regime results to the workfile.
Make Regime Results
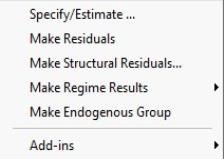
The submenu offers routines for saving transition matrix results and predicted regime probabilities into series and matrices in the workfile.
Transition Results
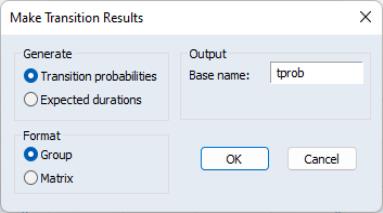
To save transition probability or expected duration results in the workfile click on
In addition to prompting you to choose between saving the or the , you must select an output format. By default, EViews will save the results in a group of series in the workfile. The series names will be formed using the base name specified in the edit field, as in “TPROB12”, “TPROB22”, etc. for transitions, and “TPROB1”, “TPROB2”, etc. for expected durations.
You may instead elect to save the results in a matrix. In this case, EViews will prompt you for the name of the matrix and for an observation at which to evaluate the transition matrix or expected duration. By default, the dialog will be filled with the first observation in the estimation sample.
Regime Probabilities
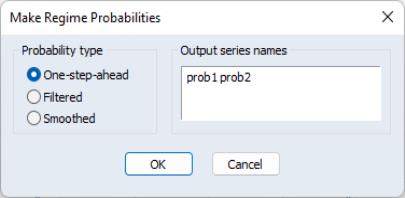
To save the regime probabilities, select
Select the type of probability you wish to compute (, , or ), and enter the names of series to hold the results, one for each probability you wish to retain.
