Table Objects
Freezing views that contain formatted text or numbers that are aligned in columns or rows produces table objects. The following sections describe the basics of working with table objects, including creating, formatting, printing, and exporting of tables.
Creating Tables
In EViews, a table may be an object view or a table object. Table views are object views that contain formatted text or numbers that are aligned in columns and rows. Examples of table views are the spreadsheet views of a series and the estimation output views of an equation. There are a limited set of customizations that are available for table views.
A table object is an independent object that contains formatted text or numbers. Table objects may be created directly, by issuing a table declaration, or indirectly, by freezing a table view. As with graph objects, table objects are “not live” in the sense that they do not reflect the current contents of the underlying object, but are based instead upon the contents of the object at the time the object was frozen. Table objects also allow for a full set of customizations.
While many of the features described here apply to both table views and table objects, the remainder of our discussion focuses on customization of table objects. Working with table views is described elsewhere (see, for example
“Changing the Spreadsheet Display”).
Table Basics
The most basic operations in a table involve selecting cells and editing cell values.
Selecting Cells
Selecting one or more cells is one of the most common tasks in working with table views and table objects. For the most part, you will find that cell selection works as it does everywhere else in Windows, but a brief review may prove useful.
The simplest selection is for a single cell. Simply click on the cell you wish to select. If the table is not in edit mode, the cell will be shaded. If the table is in edit mode, the cell will be surrounded by a black border, and the contents of the cell will be displayed in the table edit window.
For the selection of multiple cells, EViews uses the concept of an anchor cell to determine a selection region. The anchor cell is used to mark the start of the selection region and is used to indicate how a selection will change as you move the mouse or use keystrokes.
When edit mode is off, the anchor cell is marked as the cell with the black square in one of the four corners of the cell. When edit mode is on, the anchor cell is marked with a black border around the cell. You may toggle between edit mode on and edit mode off by clicking on the button on the object toolbar, or alternately, by right mouse clicking and selecting .
The easiest way to highlight a region is to (left) click in a cell to set an anchor point, then, while holding down the mouse button, move the mouse to select additional cells. In addition, cell selection shortcuts allow you to select rows and columns by clicking on row and column headers, and to select rectangular regions by clicking on a cell to set an anchor cell, then SHIFT-click to select the rectangular region defined by the anchor and ending cells. You may enter CTRL-A to select all of the cells in a table.
Some of the more frequently used selection tools include:
| |
Text in a cell | If edit mode is turned on, select the cell, double-click in it, and then select the text in the cell. Or select the cell and then select the text in the edit field. |
A single cell | Click the cell, or use the arrow keys to move the anchor cell. |
A range of cells | Click the first cell of the range, and then drag to the last cell. Or click in a cell to set the anchor, then SHIFT-click in the last cell you wish to include. Or set the anchor, and then SHIFT and press the arrow keys until desired cells are selected. |
All cells in a table | Click the corner cell shared by the column and row header (the corner cell is not visible in some output views). Or press CTRL+A. |
An entire row | Click the row heading. |
An entire column | Click the column heading. |
Adjacent rows or columns | Click and drag across the row or column headers. Or select the first row or column; then hold down SHIFT and click the last row or column heading. |
More or fewer cells than the current selection | Hold down SHIFT and click the last cell you want to include in the new selection. The rectangular range between the active cell and the cell you click becomes the new selection. Or hold down SHIFT and press the arrow keys until selection is correct. |
Note that row and column header selection is not always available in table views since the headers are not always displayed. For example, the estimation output view of an equation is a table that does not contain header lines. Freezing the view creates a table object that allows for cell selection using the visible headers.
Editing Cell Values
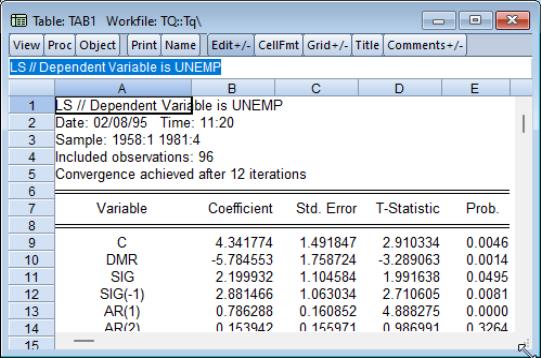
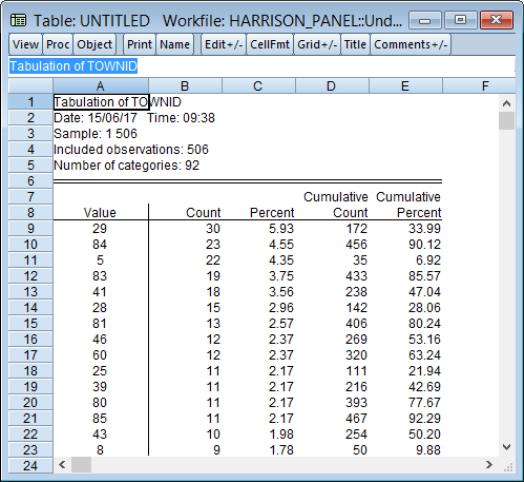
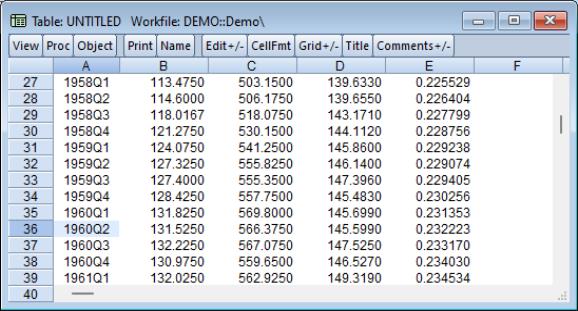
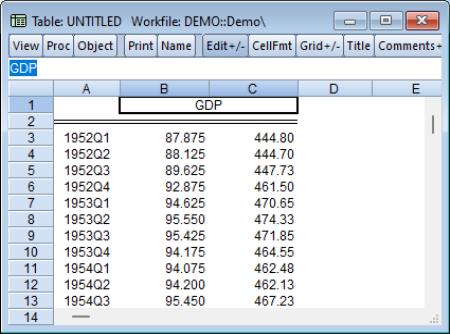
To enter or change the data in a table, you must first display the table edit window by enabling edit mode, and selecting a cell to be modified. Here, we see a table that is in edit mode, with the contents of the A1 cell displayed in the edit window just below the toolbar.
To modify the contents of the cell, simply type in the edit window. Alternately, you may double click in the cell to edit the contents. EViews will then allow you to edit the cell in place.
You may provide either alphanumeric or numeric input. If your text may be interpreted as a number, EViews will interpret the input and store the value as a number. Since the table value is stored as a number it may later be formatted using the numeric formatting tools. You may, for example, change the display of the number to scientific notation, or you may display numbers with 4 digits of precision (see
“Content Formatting”).
Note that you may enter numeric expressions and have EViews evaluate them prior to placing them in the table. To evaluate a numeric expression into a cell, type “=” before the expression. For example, entering the text “=4*5” will result in a cell value of “20”. Entering an invalid numeric expression will set the cell to a numeric NA.
This latter example raises a minor issue associated with entering missing values into a table. If the text “NA” is entered into a table cell, the cell value will be set to the string “NA”, not to the missing value NA. To enter a numeric missing value, you should enter the string “=NA” into the cell. We point out that the choice between entering the “NA” string or the NA value into a cell has consequences for auto-justification, or when saving values to a file.
Sorting Rows
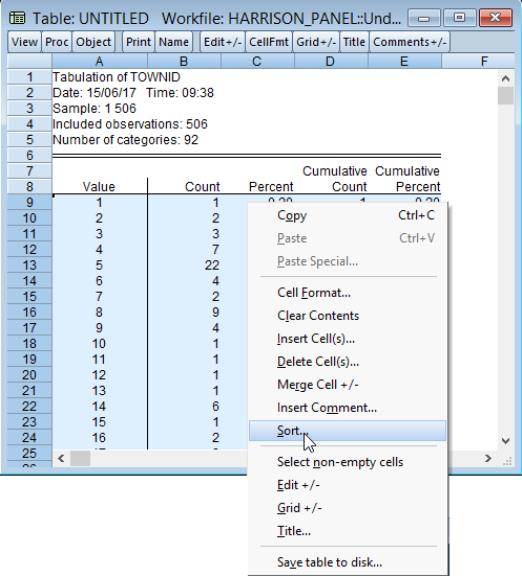
You may easily sort the rows of a table using values in one or more columns. To sort, you must be in table edit mode. Highlight the data you wish to sort (note that the sort keys must also be selected) then right-click and select in the pop-up menu:
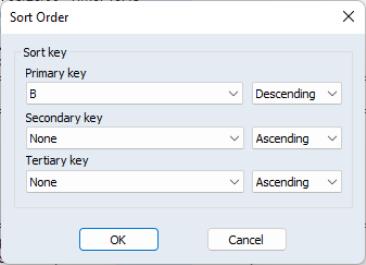
EViews will display the sort dialog prompting you to specify your sort keys and direction
You may use the dialog to choose the columns on which to sort, and whether to use ascending or descending order. The rows will first be sorted on the basis of the primary key, and ties will be broken using the secondary and tertiary keys. Note that you may remove any existing sorting using the option. Click on to sort the selection.
Note when sorting both numeric and alphabetic data in a given column that numbers will be treated as smaller than letters.
Searching Cells
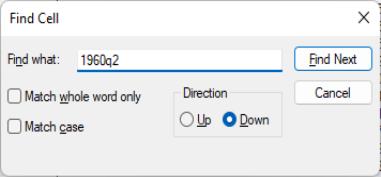
It is sometimes useful to locate a cell within a table containing a particular value or string. Selecting from the menu or pressing Ctrl+F will display the dialog:
When searching, you have the option to match the whole word, match case, and the specify the search direction. After making any selections, press the button to locate a matching cell.
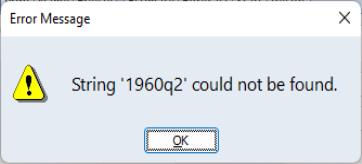
If no match is found, EViews will produce an error message,
If a match is found, the first located corresponding cell within the table will be selected:
Subsequent searches will select the next matching cell. If the end of the table is reached, EViews will resume the search from the beginning or end of the table, depending on the search direction.
Fixing Rows and Columns in Tables
EViews allows you to fix rows and columns in the display of a table so that these rows and columns are always in view as you scroll the remaining cells of the table.
There are times when it is useful to lock one or more rows or columns in a table so that those rows and columns are always in view. Depending on the contents of the table, the first few rows or columns in your table may contain identifying information about the data cells within the table. When searching for a specific cell or set of cells, fixing the display of these identifiers makes this task much easier. This is especially useful for tables containing a large number of columns or rows.
This situation often occurs, for example, when working with tables where the first row contains column names and the first column contains observation IDs. In the case when the table is scrolled both vertically and horizontally such that the 20th column and the 100th row of a table is in view it may be helpful to see the column names and observation IDs to have provide context to the contents of the cell.
Fixing columns and rows in a table can be done by pressing the button in a table object button bar. Then,
• To fix only the first row, select . If more than 1 row is to be fixed, select a cell in the first row after the last desired fixed row and then from the menu select . For example, to fix the first 3 rows of table, select a cell in the fourth row and then select .
• The process for fixing columns is the same as fixing rows with the obvious exception of selecting
• Similarly, after navigating through the proc menu, the columns proceeding the current selected cell will be fixed. Note the fixed columns and rows will be denoted in the table by a black cell border.
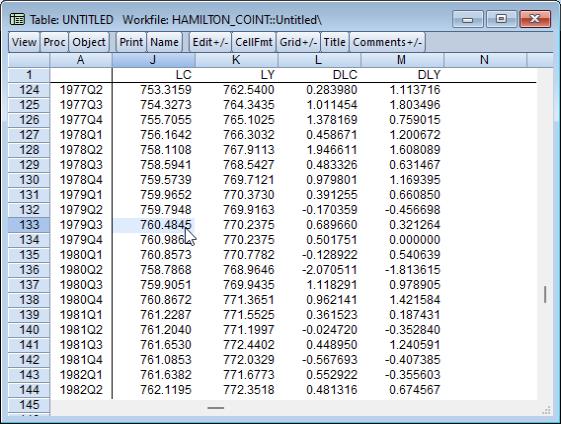
In the image below which fixes the first row and column of the table, you can see the date column (column A) and the series names (row 1) are in view despite the table being scrolled vertically 123 rows and 13 columns where row 124 is the first row, and column J is the first column displayed.
The fixed columns are denoted by a black cell border that extends from the top to bottom of the table and the fixed rows are separated by a similar black border that extends from the left to right of the table.
With fixed headers and rows, we can readily identify the selected cell as being the value for LC for 1979q3.
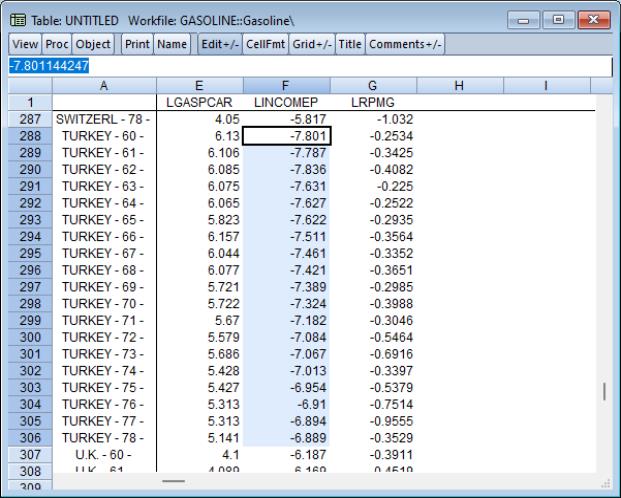
In this second example, the fixed first row and column of the table makes it easy to identify the LINCOMEP values for Turkey from 1960 to 1978 despite the fact that the displayed values are for the 288th row and column F of the table.
To unfix any fixed rows or columns, simply press the button and either select or . Note: the cell selection is ignored when unfixing rows or columns.
Basic Customization
You may perform basic customization of a table object by attaching a title, by adding or hiding the grid lines, or by resizing the rows or columns.
Table Title
To add a header title to the top of a table object, you should select from the table menu, or you may click on the button on the toolbar. EViews will display a dialog prompting you to enter your title. When you enter text in this dialog, EViews displays a header title at the top center of the table. Note that the table title is different from the table name, which provides the object name for the table in the workfile.
To remove the table title, display the title dialog, then delete the existing title.
Grid Lines
To toggle on or off the grid marking the cells in the table object, click on the button on the table toolbar, or select from the main table menu.
Resizing Columns and Rows
Column widths may easily be resized in both table views and in table objects. Simply place your cursor over the separator lines in the column header. When the cursor changes to the two-sided arrow, click and drag the column separator until the column is the desired size. If you wish to resize more than one column to the same size, first select the columns you wish to resize, then drag a single column separator to the desired size. When you release the mouse button, all of the columns will be resized to the specified size.
Row heights may only be resized in table objects. Place your cursor over the separator lines in the row header and drag the separator until the row is the desired height. If you wish to resize more than one row, first select the rows you wish to resize, then drag a separator to the desired size. All of the rows will be resized to the specified size.
Double clicking a column/row edge in the header will resize the row or column to the minimum height or width required so that all of the data in that row or column is visible.
Table Cell Customization
EViews provides considerable control over the appearance of table cells, allowing you to specify content formatting, justification, font face, size, and color, cell background color and borders. Cell merging and annotation are also supported.
Cell Formatting
You may select individual cells, ranges of cells, or the entire table, and apply various formatting tools to your selection. To format the contents of a set of cells, first make certain that the table is in edit mode. Next, select a cell region, then click on in the toolbar, or right mouse click within the selected cell region and select . EViews will open the dialog containing three tabs: , , and .
Content Formatting
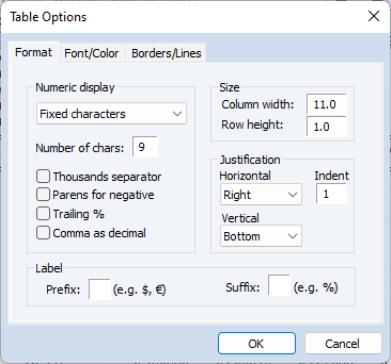
The tab allows you to apply display formats to the contents of cells in table objects. Formatting of table objects may be cell specific, so that each cell may contain its own format.
You may also modify the display of numeric values, set column widths and row heights, and specify the justification and indentation.
Bear in mind that changing the height of a cell changes the height of the entire row and changing the width of a cell changes the width of the column. Column widths are expressed in unit widths of a numeric character, where the character is based on the default font of the table at the time of creation. Row height is measured in unit heights of a numeric character in the default font.
For additional discussion of content and cell formatting, see the related discussion in
“Changing the Spreadsheet Display”.
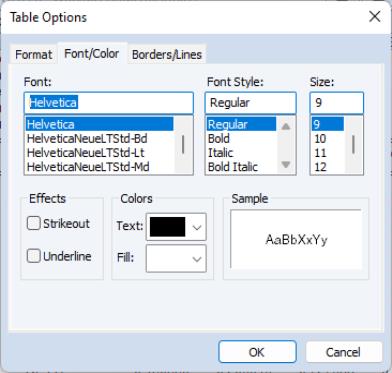
Fonts and Fill Color
The tab allows you to specify the font face, style, size and color for text in the specified cells. You may also add strikeout and underline effects to the font. This dialog may also be used to specify the background fill color for the selected cells.
Where possible, the window displays a preview of the current settings for the selected cells. In cases where it is impossible to display a preview (the selected cells do not have the same fonts, text colors, or fill colors) the sample text will be displayed as gray text on a white background.
Note also that EViews uses the special keyword to identify cases where the selection region contains more than one text or fill color. To apply new colors to all of the selected cells, simply select a or color and click on .
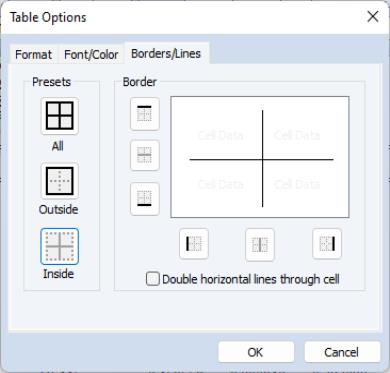
Borders and Lines
The last tab, labeled is used to specify borders and lines for the selected table cells.
Simply click on any of the or buttons to turn on or off the drawing of borders for the selected cells, as depicted on the button. As you turn on and off border lines, both the buttons and the display on the right will change to reflect the current state of your selections. Note also that there is a checkbox allowing you to draw double horizontal lines through the selected cells.
It is worth noting that the appearance of the page will differ slightly depending on whether your current selection contains a single cell or more than one row or column of cells. In this example, we see the dialog for a selection consisting of multiple rows and columns. There are three sets of buttons in the section for toggling both the row and column borders. The first and last buttons correspond to the outer borders, and the second button is used to set the (between cell) inner border.
If there were a single column in the selection region, the display would only show a single column of “Cell Data”, and would have only two buttons for modifying the outer vertical cell borders. Similarly, if there were a single row of cells, there would be a single row of “Cell Data”, and two buttons for modifying the outer horizontal cell borders.
Cell Annotation
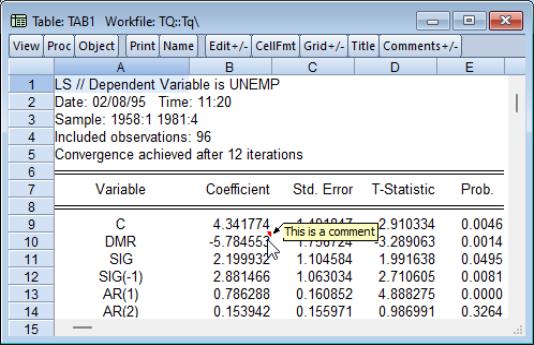
Each cell of a table object is capable of containing a comment. Comments may be used to make notes on the contents of a cell without changing the appearance of the table, since they are hidden until the mouse cursor is placed over a cell containing a comment.
To add a comment, select the cell that is to contain the comment, then right mouse click and select to open the dialog. Enter the text for your comment, then click . To delete an existing comment, just remove the comment string from the dialog.
If comment mode is on, a cell containing a comment will be displayed with a small red triangle in its upper right-hand corner. When the cursor is placed over the cell, the comment will be displayed.
If comment mode is off, the red indicator will not be displayed, but the comment will still appear when the cursor is placed over the cell.
Use the button in the tool bar to toggle comment mode on and off. Note that the red triangle and comment text will not be exported or printed.
Cell Merging
You may merge cells horizontally in a table object. When cells are merged, they are treated as a single cell for purposes of input, justification, and indentation. Merging cells is a useful tool in customizing the look of a table; it is, for example, an ideal way of centering text over multiple columns.
To merge several cells in a table row, simply select the individual cells you wish to merge, then right click and select -. EViews will merge the cells into a single cell. If the selected cells already contain any merged cells, the cells will be returned to their original state (unmerged).
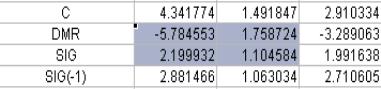
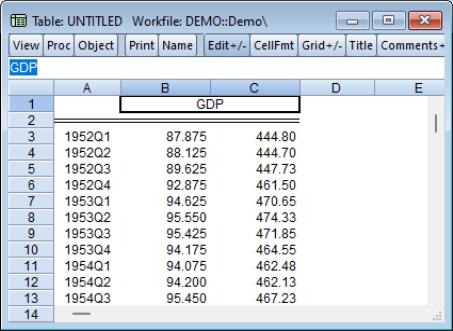
Here, we begin by selecting the two cells B1 and C1. Note that B1 is the anchor cell, as indicated by the edit box surrounding the cell, and that B1 is center justified, while C1 is right justified.
If we right mouse click and select , the two cells will be merged, with the merged cell containing the contents and formatting of the anchor cell B1. If you wish C1 to be visible in the merged cell, you must alter the selection so that C1 is the anchor cell.
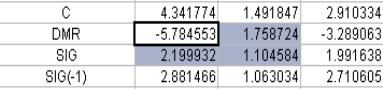
We see that the B1 and C1 cells are merged, as indicated by the large selection rectangle surrounding the merged cells.
Bear in mind that the C1 cell has not been cleared; its contents have merely been hidden behind B1 in the merged cell. Editing the value of the merged cells will replace the value in the cell B1, but has no effect on hidden cells, in this case C1.
If the merged cell is selected, toggling will unmerge the cell so that cells are returned to their original form. The contents of C1 will once again be visible and may be modified using any of the table display formatting tools.
Printing Tables
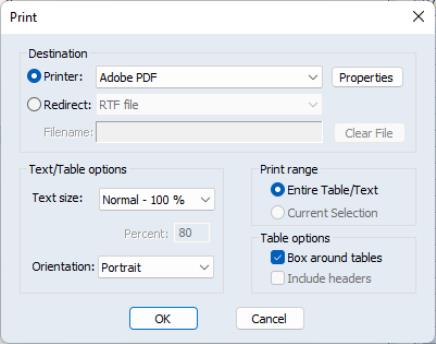
To print a table object, click on the button on the table tool bar or select from the main EViews menu to display the dialog.
The top section of the dialog may be used to select a printer and print options, or to redirect the print job to an RTF file, text file, table object, or spool object (see
“Print Setup”).
You may use the remainder of the dialog to scale all of the text in the table, to select the orientation of the table ( or ), to draw or not draw a box around the table, and to include or not include the table headers in the print job.
If you have selected a range of cells in the table, the section of the dialog will offer you choice of printing the entire table or only printing the current selection.
Copying Tables to the Clipboard
You may copy-and-paste a table to the Windows clipboard, from which you may paste the table contents into your favorite spreadsheet or word processing software.
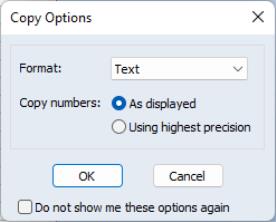
Simply select the cells that you wish to copy and then choose from the EViews main menu, or from the right mouse button menu. The dialog box will open, providing you with the option of copying the numbers as they appear in the table, or at their highest internal precision.
After you make a choice, EViews will place the table on the clipboard in Rich Text Format (RTF), allowing you to preserve the formatting information built into the table. Thus, if you copy-and-paste a table from EViews into Microsoft Word or another program which supports RTF, you will create a nicely formatted table containing your results.
To paste the clipboard contents into another application, switch to the destination application and select . Note that some word processors provide the option of pasting the contents of the clipboard as unformatted files. If you wish to paste the table as unformatted text, you should select .
Saving Tables to a File
EViews allows you to save your table objects in several file formats: Comma Separated Value (CSV), tab-delimited text (ASCII), Rich Text Format (RTF), Web page (HTML), Enhanced Metafile (EMF), Portable Document Format (PDF), LaTeX (TEX), or Markdown (MD) file.
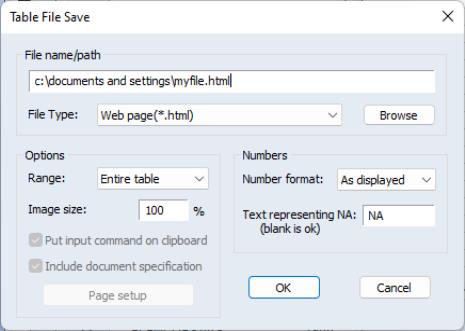
To save the table to disk, with the table window active or with table cells selected, right mouse click or select , then select to bring up the dialog. The dialog displays default values from the global settings.
In the top portion of the dialog, you should provide the name of the file you wish to create. EViews will automatically append an extension of the proper type to the name (here, “.HTM” since we are saving a Web HTML file), and will prepend the default path if an explicit path is not provided.
Next, select the . You may select , , , , , or . The options section of the dialog allows you to save the entire table or only those cells that are currently selected, and, for all but CSV and ASCII files, to scale the table size.
You may also specify options for how numbers are to be treated when written. You may specify a so that numbers are written in the table, or using . In addition, you may change the text used to write missing values.
For LaTeX output, you have the additional option to output full LaTeX document specification. Alternatively, you can disable the option and the minimal amount of code will be generated for you to insert into your preexisting document.
The MD (Markdown) setting uses very basic syntax and should be usable in most editors.
Importing Tables
You may import data into a table object from a foreign data source, such as Excel or text files using the File/Import/Table from file... menu option. The import process closely resembles that for importing data into a series object, as outlined in.
Table Commands
EViews provides tools for performing extensive table customization from the command line or using programs. See
“Table” for additional details.