Frequency Conversion
Every series in EViews has an associated frequency. When a series is in a workfile, the series is stored at the frequency of the workfile. When a series is held in a database (
“EViews Databases”), it is stored at its own frequency. Since all series in the same workfile page must share a common frequency, moving a series from one workfile to another or from a database to a workfile page will cause the series being moved to be converted to the frequency of the workfile page into which it is being placed.
Performing Frequency Conversion
Frequency conversion is performed in EViews simply by copying or fetching a series with one frequency into a workfile of another frequency.
Copy-and-Paste
Suppose that you have two workfile pages (or a source database and a destination workfile page), where the source contains quarterly data on the series YQ, and the destination workfile contains annual data. Note that you may copy between pages in the same workfile or between separate workfiles.
To convert YQ from a quarterly to annual frequency, you may copy-and-paste the series from the source quarterly workfile to the annual workfile. Click on the YQ series in the quarterly workfile, press the right-mouse button and select , navigate to the annual workfile, then right mouse button and select or .
If you select , EViews will copy YQ to the annual page, using the default frequency conversion settings present in YQ to perform the conversion.
If you select , EViews will display a dialog offering you the opportunity to override the default frequency conversion settings. Before describing this dialog (
“Overriding Default Conversion Methods”), we provide a background on frequency conversion methods, and describe how default conversion methods are specified in EViews.
Drag-and-Drop
An alternative to copy-and-paste is to use drag-and-drop to copy files between workfile pages. Simply select the series to be copied, then drag-and-drop them on the destination page tab. If you use the right-mouse button to select the series, dropping them on the new tab will bring up the dialog.
You can even drag-and-drop a workfile page tab into a workfile window to copy all of the objects from one workfile page into another. Depending on the objects being copied and the frequencies of the workfiles, you may receive a series of prompts to assist in completing the paste properly.
Using Commands
You may use either the copy or fetch command to move series between workfiles or between a database and a workfile. EViews will perform frequency conversion if the frequencies of the source and destination do not match.
See
copy and
fetch for details.
Frequency Conversion Methods
There are three types of frequency conversion: high frequency to low frequency conversion, low frequency to high frequency conversion, and frequency conversion between a dated and undated workfile.
EViews provides you with the ability to specify methods for all types of conversion. In addition, there are settings that control the handling of missing values when performing the conversion.
High Frequency to Low Frequency
If a numeric series being imported has a higher frequency than the workfile, you may choose between a number of different conversion methods:
• Average observations
• Sum observations
• First observation
• Last observation
• Maximum observation
• Minimum observation
• Split observations.
• Split last observations.
• No down conversions
with the latter setting permitting you to disallow high to low conversions. In this case, EViews will generate an error if you attempt to convert from high to low frequency.
Most of these choices are self-descriptive. For example, the setting will compute the average of the high frequency observations for a given low frequency observation. Similarly, the Minimum observation setting
The two split observations methods require some discussion:
• The method creates multiple low frequency series from the single high-frequency series. By default, split will create a series for each high-frequency period within the destination low frequency period. For example, when copying between a monthly page and a quarterly page, the split option will create three series. The first series will contain the first monthly observation in each quarter, the second series will contain the second observation, and the third series will contain the third monthly observation.
When copying between a page with seven-day daily frequency and a page with monthly frequency, 31 different series will be created, with some of those series containing NAs if the month does not have the corresponding day (February will contain NAs for series 31, 30 and, in non-leap years, 29).
• The field may be used to indicate which high-frequency periods will be used to create the low-frequency series. You should entering the corresponding periods in a space delimited list, or as a range with a hyphen. For example, if copying from monthly to quarter and you only want to generate series for the second and third months of the quarter, you would enter “2 3”.
• The method is identical to the split observations method with indexing starting at the end of the low-frequency period rather than the start. Thus when copying from daily to monthly and entering and index of “1 2 3 4 5” or “1-5” the last 5 days of each month will be used to create the monthly series rather than the first.
For all conversion methods, you may specify how EViews handles missing data when carrying out the calculations. You may elect (by checking the box) to propagate NAs so that whenever a missing value appears in a calculation, the result for the corresponding period will be an NA.
Alternatively, you may elect not to propagate NAs so that calculations will be performed ignoring the missing values (though if all values for a period are missing, the corresponding result will still be an NA).
Low Frequency to High Frequency
EViews also provides a number of different interpolation methods for dealing with the case where the series being brought into the workfile has a lower frequency than the workfile. Since observing a series at a lower frequency provides fundamentally less information than observing the same series at a higher frequency, it is generally not possible to recover the high frequency series from the low frequency data. Consequently, the results from EViews’ interpolation methods should be considered to be suggestive rather than providing the true values of the underlying series.
EViews supports the following interpolation methods:
• : Constant with sum or average matched to the source data.
• : Local quadratic with sum or average matched to the source data.
• : Linear with first or last observation matched to the source data.
• : Cubic spline with first or last observation matched to the source data.
• : Copy the low frequency data into the first or last observation for the corresponding high frequency range.
• : Statistical interpolation minimizing the proportional first difference between the interpolated and high frequency target series.
• : Regression-based interpolation relating one or more high frequency target series to the low frequency series.
• : Random walk variant of Chow-Lin.
• : Do not allow up conversion.
Using an interpolation method which matches the average means that the average of the interpolated points for each period is equal to the source data point for that period. Similarly if the sum is matched, the interpolated points will sum to the source data point for the period, and if the last observation is matched, the last interpolated point will equal the source data point for the period.
For all methods, all relevant data from the low frequency series is used when forming the high frequency series, even if the destination observations are a subset of the observations available in the source.
The following describes the different methods in greater detail.
Constant
The constant method assigns the same value to all observations in the high frequency series associated with a particular low frequency period. If you match average, the value is chosen so that the average of the high frequency observation matches the low frequency observation (the value is simply repeated). If you match sum, the value is chosen so that the sum of the high frequency observations matches the low frequency observation (the value is divided by the number of observations).
Quadratic
Fits a local quadratic polynomial for each observation of the low frequency series, then use this polynomial to fill in all observations of the high frequency series associated with the period. The quadratic polynomial is formed by taking sets of three adjacent points from the source series and fitting a quadratic so that either the average or the sum of the high frequency points matches the low frequency data actually observed. For most points, one point before and one point after the period currently being interpolated are used to provide the three points. For end points, the two periods are both taken from the one side where data are available.
This method is a purely local method. The resulting interpolation curves are not constrained to be continuous at the boundaries between adjacent periods. Because of this, the method is better suited to situations where relatively few data points are being interpolated and the source data is fairly smooth.
Linear:
This method assigns each value in the low frequency series to the first or last high frequency observation associated with the low frequency period, then places all intermediate points on straight lines connecting these points.
Cubic
This method assigns each value in the low frequency series to the first or last high frequency observation associated with the low frequency period, then places all intermediate points on a natural cubic spline connecting all the points.
A natural cubic spline is defined by the following properties:
1. Each segment of the curve is represented by a cubic polynomial.
2. Adjacent segments of the curve have the same level, first derivative and second derivative at the point where they meet.
3. The second derivative of the curve at the two global end points is equal to zero (this is the “natural” spline condition).
Cubic spline interpolation is a global interpolation method so that changing any one point (or adding an additional point) to the source series will affect all points in the interpolated series.
Point
The point method simply copies the low frequency data into the first or last observation for the corresponding high frequency range.
Denton
This method finds an interpolated series

by relating a higher-frequency indicator series

to a lower-frequency benchmark series

. This is done by minimizing the proportional first difference function proposed by Denton (1971):
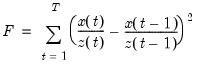 | (5.1) |
This can be solved as a constrained optimization problem subject to the constraints:
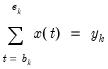 | (5.2) |
with the benchmark

in each period

, and

and

are the beginning and end of each period. For stock variables the constraints apply at specific points in time (

) where the interpolated series is equal to the benchmark

. For index and flow variables the average or sum of the interpolated series over each period

are equal to the benchmark

for that period. For flow variables this process is sometimes called
temporal distribution/disaggregation instead of interpolation.
EViews uses Cholette's (1984) modification of Denton's original method to remove a transient movement at the beginning of the interpolated series.
The goal of Denton interpolation is movement preservation: the interpolated series

should preserve the movement in the indicator series

as much as possible. While there are many ways to specify the constraint problem, EViews uses the more popular proportional first difference in
Equation (5.1) and
Equation (5.2), which minimizes the proportional period-to-period change in the interpolated and indicator series. This produces an interpolated series that closely follows the growth rate of the indicator series.
Denton interpolation is a global interpolation method. Changing any point or adding points to the indicator or benchmark series will affect all points in the interpolated series. Also note that Denton interpolation can be performed without an indicator series in a procedure sometimes termed
benchmarking (in practice, the indicator series

in
Equation (5.1) is replaced by ones). In cases where the indicator series extends beyond the period covered by the endpoints of the benchmark series,

will be extrapolated with the last benchmark/indicator ratio.
Chow-Lin
The Chow-Lin method is a regression-based interpolation technique that finds values of a series

by relating one or more higher-frequency indicator series

to a lower-frequency benchmark series through the equation
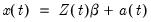 | (5.3) |
where

is a vector of coefficients and

is a random variable with mean zero and covariance matrix

. The interpolated series is subject to the same constraints as in
Equation (5.2) for stock, index, and flow variables. While the original solution by Chow and Lin (1971) used generalized least squares to estimate the covariance matrix assuming that the errors follow an AR(1) process, EViews uses a state space model with the following time series model for the states:
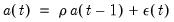 | (5.4) |
where
and

. The parameters

and

are estimated via maximum likelihood and the Kalman filter, and the interpolated series is subsequently calculated with Kalman smoothing.
Chow-Lin interpolation is a global interpolation method, and changing any point or adding points to the indicator or benchmark series will affect all points in the interpolated series. Also note that Chow-Lin interpolation can be done without an indicator series (in practice, the indicator matrix

in
Equation (5.3) is replaced by a vector of ones). In cases where the indicator series extends beyond the period covered by the endpoints of the benchmark series,

will be extrapolated using the Kalman filter.
Litterman
For the Chow-Lin method the calculation of the interpolated series requires knowledge of the covariance matrix

, which is usually not known. Various techniques use various assumptions about the structure of

beyond the simplest (and unrealistic) case of homoskedastic, uncorrelated residuals. A common flavor of Chow-Lin is Litterman interpolation, in which the covariance matrix is calculated from residuals that follow:
where

and
and the initial condition

. This is essentially an ARIMA(1,1,0) model.
Undated Conversion
If you fetch or copy a series to or from an undated or unstructured workfile into or from a dated workfile, the data will be copied sequentially, beginning at the starting observation number of the undated or unstructured series (generally the first observation).
Panel Conversion
Performing frequency conversion when either the source or destination are panel workfile pages raises a number of additional issues. See
“Panel links with date matching” and
“Panel frequency conversion” for discussion of the general issues.
Specifying Default Conversion Methods
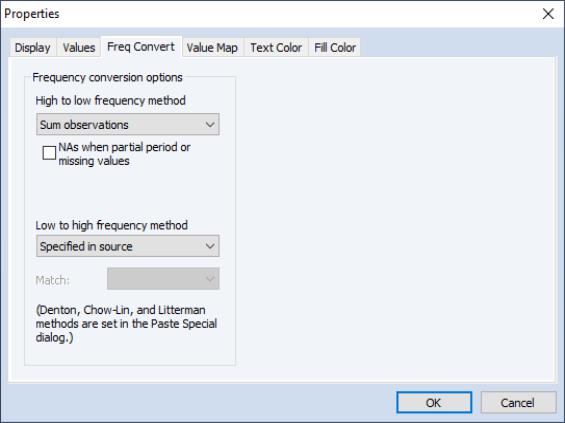
When performing frequency conversion of one or more series, EViews uses the default settings in each series to perform the conversion. These settings may be specified in each series using the tab of the dialog. To access the dialog, click on the button on the series toolbar and select the Freq Convert tab.
If the series default setting is set to , the series will take its frequency conversion setting from the EViews global options (see
“Frequency Conversion” in
Appendix A. “Global Options”). Here, the high to low conversion is set to , overriding the global setting, while the low to high uses the setting.
This two level default system allows you to set global default settings for frequency conversion that apply to all newly created series, while allowing you to override the default settings for specific series.
As an example of controlling frequency conversion using default settings, suppose you have daily data consisting of HIGH, LOW, and CLOSE series for a particular stock, from which you would like to construct a monthly workfile. If you use the default frequency conversion methods, the monthly workfile will contain series which use the series defaults, which is not likely to be what you want. By setting the frequency conversion method of the HIGH series to , of the LOW series to , and of the CLOSE series to , you may use conversion to populate a monthly workfile with converted daily data that follow the desired behavior.
Overriding Default Conversion Methods
If you use copy-and-paste to copy one or more series between two workfiles, EViews will copy the series to the destination page, using the default frequency conversion settings present in the series to perform the conversion.
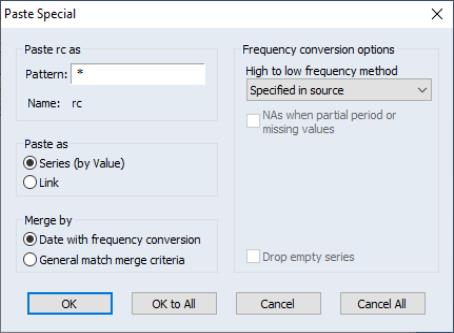
If, when pasting the series into the destination, you use in place of , EViews will display a dialog offering you the opportunity to override the default frequency conversion settings.
You need not concern yourself with most of the settings in this dialog at the moment; the dialog is discussed in greater detail in
“Frequency conversion links”.
We note, however, that the dialog offers us the opportunity to change both the name of the pasted YQ series, and the frequency conversion method.
The “*” wildcard in the Pattern field is used to indicate that we will use the original name (wildcards are most useful when pasting multiple series). We may edit the field to provide a name or alternate wildcard pattern. For example, changing this setting to “*A” would copy the YQ series as YQA in the destination workfile.
Additionally, we note that the dialog allows us to use the frequency conversion method or to select alternative methods.
If, instead of copy-and-paste, you are using either the
copy or
fetch command and you provide an option to set the conversion method, then EViews will use this method for all of the series listed in the command (see
copy and
fetch for details).