Add-ins Examples
Summarize Equation Results
Our first example is a global Add-in (EqTabs) that creates a table summarizing the results from multiple equations. If you have not already downloaded and installed this Add-in, we recommend that you do so now. We employ the workfile “Demo.WF1” (which may be found in the examples subdirectory of your EViews installation directory.
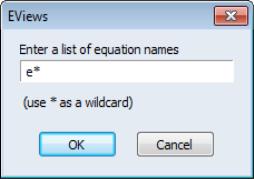
To run the Add-in, go to the main EViews menu, and select . EViews will display a dialog prompting you for the names of the equations you wish to summarize:
The default entry of “e*” is sufficient for this example since we want to summarize results for the previously estimated equations EQ01 and EQ02. Click on to continue.
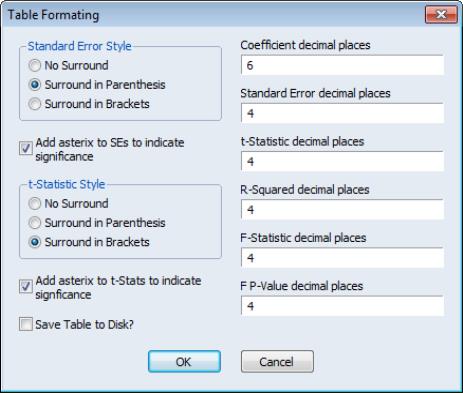
EViews will display a series of dialogs prompting you to specify the headers you wish to include in the summary table, the information you wish to display, and the display format. For example, the last dialog lets you choose the standard errors and t-statistics display formats, along with the number of significant digits for coefficients and other statistics:
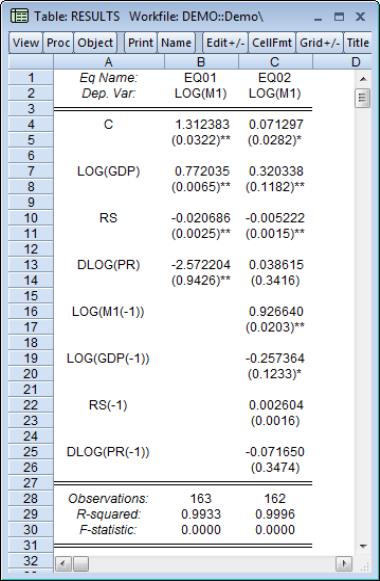
EViews will use the specified settings in constructing a table that summarizes the results from all of the specified equations.
You may also launch the Add-in from the command line or via batch execution of a program file. Simply enter the user-defined command:
eqsumtab eq*
in the command line or include it in your batch program. The command instructs EViews to run the program, displaying the set of dialogs prompting you for additional input, and constructing the table accordingly.
U.S. Recession Graph Shading
Our second example uses the graph-specific Add-in (RecShade) to add shading for periods of U. S. recession (as determined by the National Bureau of Economic Research).
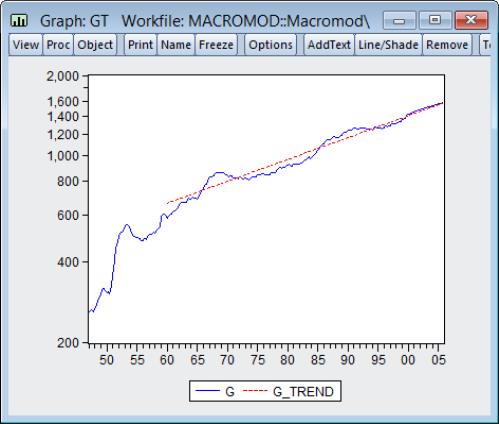
We start by opening the graph object GT in the “Macromod.WF1” workfile (which may be found in the example files subdirectory of your EViews installation directory).
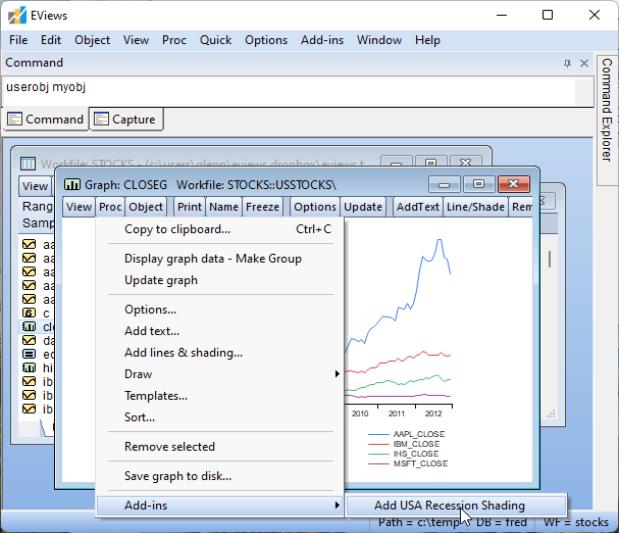
Next, click on the menu item in the graph toolbar to display the Add-ins we have installed that work with graph objects. In this case, there is only a single menu item :
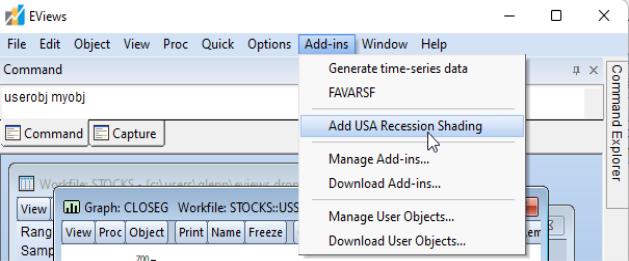
You may also access the active object menu items by clicking on the entry in the main EViews menu. When the graph object GT is the active object, the main menu shows both the global and graph specific menu items:
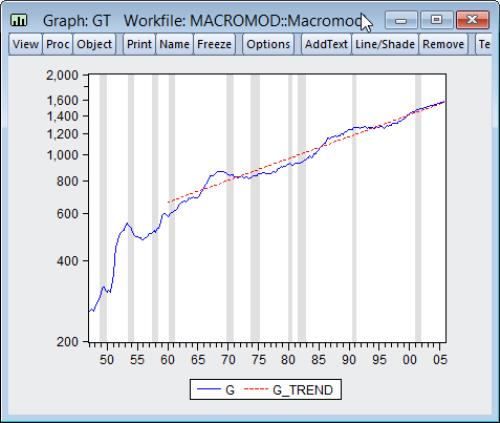
Selecting the entry in either the main or graph object Add-ins menu runs the Add-in program which adds shading to the existing graph:
For those who prefer to use a command, you may go to the command line and enter the user-defined object command
gt.recshade
to apply the recession shading. This command may also be included in a program file for batch execution.
