Cumulative standard deviations (population – non-d.f. adjusted).
Increasing samples calculation of the square root of the population (non-d.f. adjusted) Pearson product moment variance.
Syntax: @cumstdevp(x, [s])
x: series
s: (optional) sample string or object
Return: series
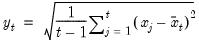
The population standard deviation is calculated for each observation

as
where

is the mean of

over the first

observations.
This function is panel aware.
Examples
series x = @nrnd
group g @cumstdev(x) @cumstdevs(x) @cumstdevp(x)
g.line
plots @cumstdev(x), @cumstdevs(x), and @cumstdevp(x) together. Note that @cumstdev(x) and @cumstdevp(x) are equivalent. All three series converge in probability to 1.
Cross-references
For the backward variant of this function, see
@cumbstdevp.