Creating and Configuring a Geomap
To create a geomap object in a workfile, you may select from the workfile menu, optionally enter a name in the edit field, and click on . Alternately, you may simply enter the declaration command geomap followed by an optional name in the command window, then press .
Loading a Shapefile
To load a shapefile simply drop a shapefile (“.prj”) file in the client area of the window, or click to open a file dialog and navigate to and open the file.
Linking Shapes to Observations
(If you do not wish to use workfile data to label or color shapes, you may skip the following step. While this step is optional, geomaps are at their most useful when you associate individual shapes in the shapefile to observations in the workfile.)
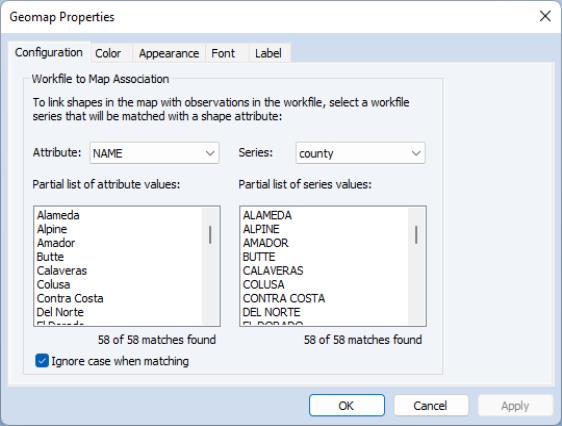
Once a shapefile has been loaded, you will be prompted to link the shapes in the shapefile with the observations in the workfile:
• First, you should use the left dropdown menu to select the shapefile attribute whose values you will match to data in the workfile.
• Next, you should use the right dropdown menu to select the series in the workfile that will be used to identify which observations in the workfile will be paired to a shape.
As you make selections in the dropdown menus, EViews will show you a partial list of the unique values from the specified shapefile attribute and series. Matches between the values in the shapefile attributes and the values series will be used for linking a shape with a workfile observation.
If there is more than one observation in the series that matches a shapefile attribute value, the first observation matching observation will be used.
Below each box is a description identifying how many elements in each list will be paired. Note that there may be some shapes in the shapefile without a corresponding observation in the workfile and vice versa.
Once you are satisfied with your selections, click on to continue.
Labeling the Shapes
The dropdown menu on the geomap button bar allows you to set the shape labels using shapefile attributes, values for series in the workfile, custom labels, or no labels.
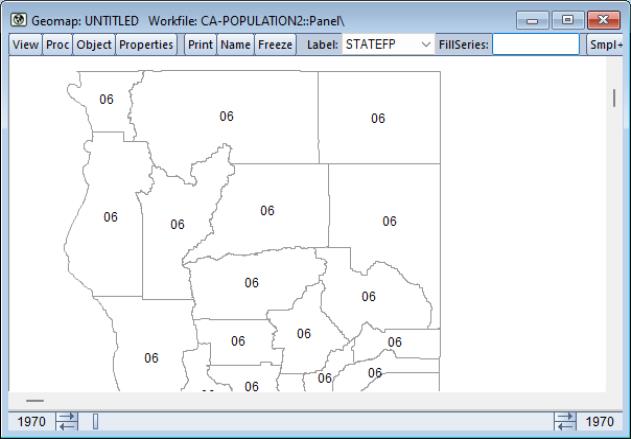
After first loading a shapefile, you will see a rendering of the shapes. Each shape will be labeled using the first attribute found in the shapefile. In the example below, STATEFP was the first attribute in the file:
The dropdown will contain all of the shapefile attributes, as well as entries for , and and you may use the dropdown menu to quickly change labels between any of the entries. The is self-explanatory, and will be described below.
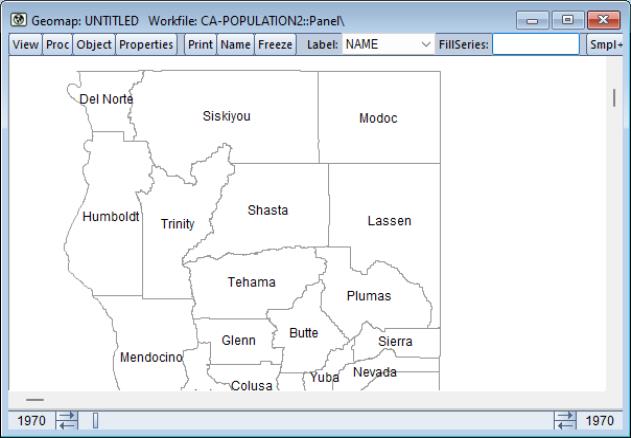
For example, changing the label to show the “NAME” attribute yields:
Should the default position of a label not be ideal, it may be adjusted manually. Simply click and drag a label to its desired location:
Fill Values Labeling
If you have successfully linked the shapes in the shapefile to the observations in the workfile (
“Linking Shapes to Observations”), you may also label the shapes using values of a series in the workfile.
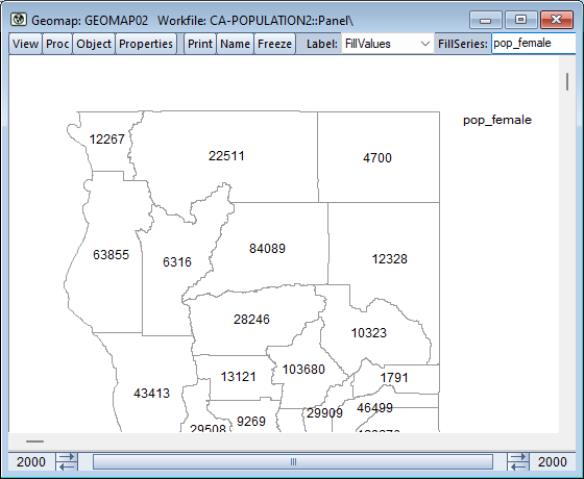
Enter a series name in the edit field on the button bar, and use the dropdown to select . EViews will use the values in the specified series as labels for each shape. For example, we may select the POP_FEMALE series to label easy of the shapes in our linked geomap:
Custom Labeling
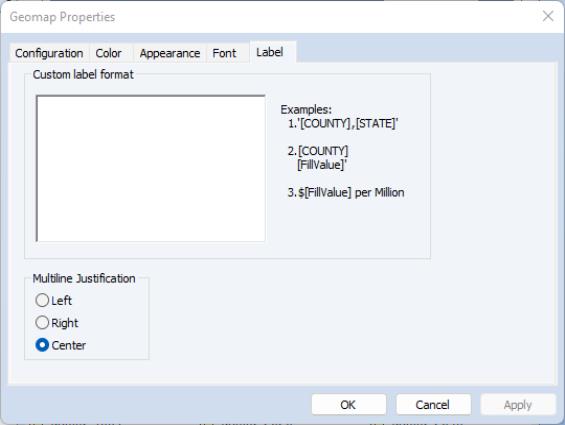
To custom label each shape, you must first define the contents of each label. Click on , then the tab, to display a dialog in which you may provide a definition for custom labels:
You may use a combination of attributed names (enclosed in “[“ and “]”), the special keyword “[FillValue]” to refer to the values in the described in
“Fill Values Labeling”.
You may use also apply custom formatting including font family and size using the tab.
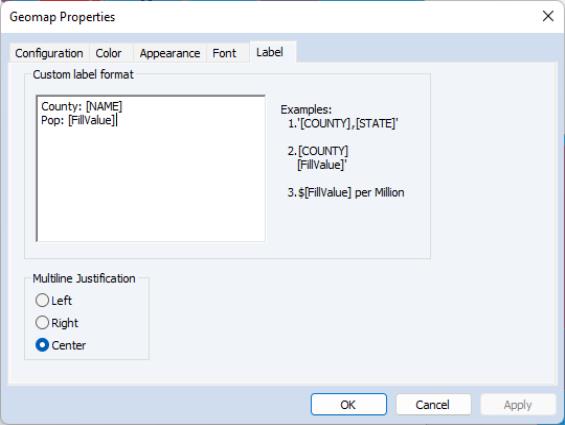
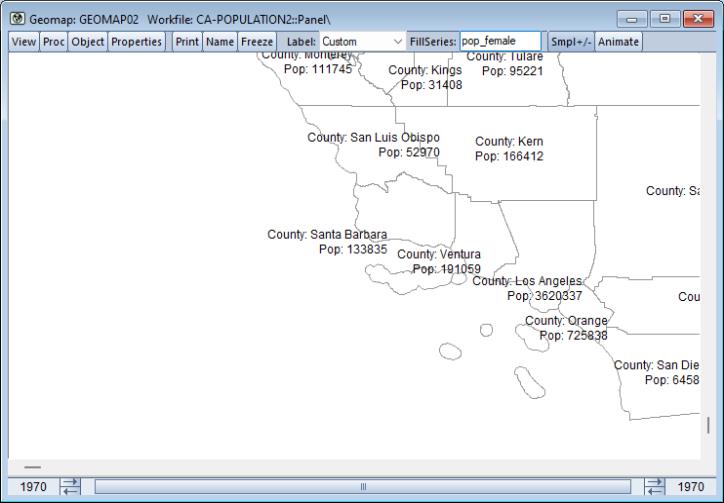
Here we use the attribute “NAME” and the value of the workfile series POP_FEMALE to create a custom, multi-line label for each shape:
For legibility, we have manually adjusted the position of some of the labels by dragging them to new locations
Assigning Fill Colors
Once you have successfully linked the shapes in the shapefile to the observations in the workfile (
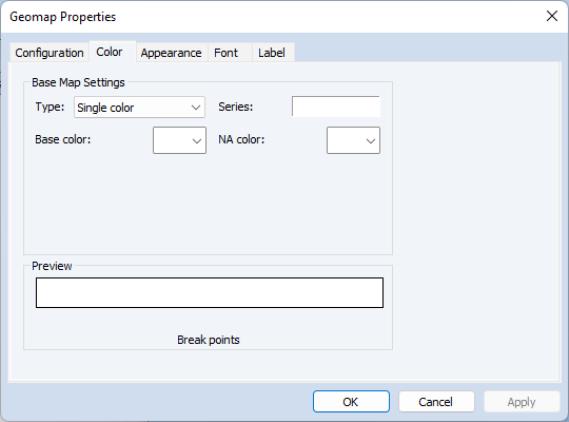
“Linking Shapes to Observations”), you may define a colormap to assign values from the workfile to each shape, and to use these values for coloring. To set the color settings for each shape, press the button and then choose the tab:
Here, we see that the fill is set to a of white. The display reflects this setting.
We are going to define a custom color map that uses the female population series (POP_FEMALE) to determine the fill color (for more on colormaps, see
“Value-Based Text and Fill Coloring”).
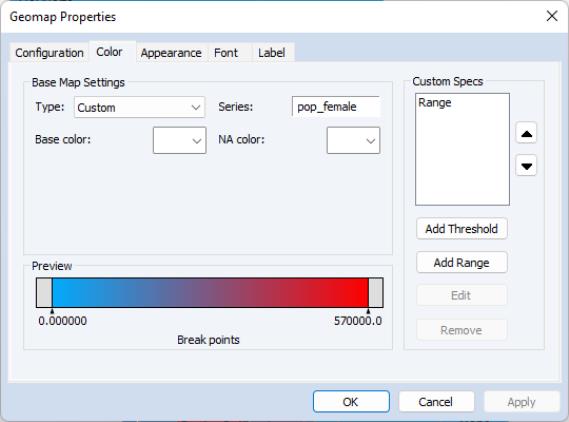
We change the settings in the dialog so that the colors will blend from blue to red as the population ranges from 0 to 570,000, regions with NA values for POP_FEMALE will be displayed with a white fill, and values outside of the range will be grey fill. We will use the a color range specification to define these settings.
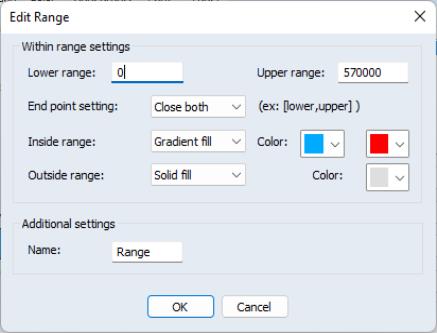
Click on the button, to bring up the custom range setting dialog:
Notice that we use the default Name of Range. If we are going to create more than one range specification, you may wish to provide a more informative name.
Clicking on creates the custom specification “Range” and returns to the main dialog. The window on the bottom shows the current color settings:
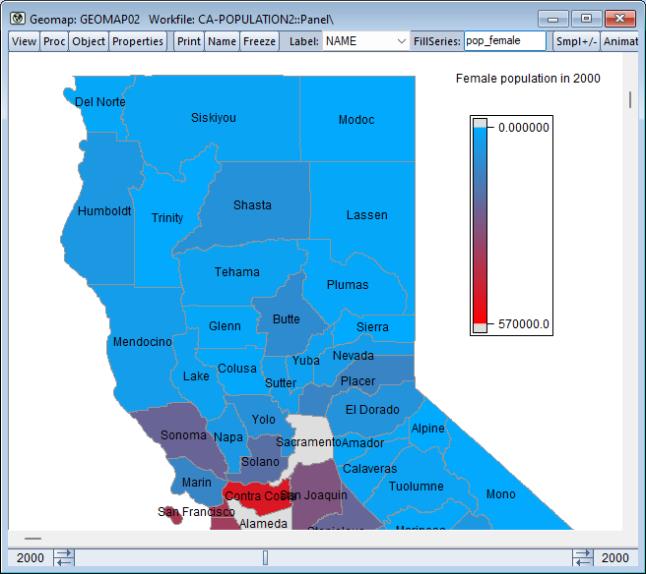
After applying the colormap by pressing in the dialog and changing the slider to 2020, we now see the female population in year 2020:
Hiding Observations and Shapes
Recall that geomap contains all of the shapes in the original shapefile. When you link the observations in your workfile to these shapes, you create a correspondence between observations in the workfile and those shapes.
Note however, that this correspondence may not be complete:
• There may be observations in the workfile that do not have shapes in the shapefile
• There may be shapes in the shapefile which do not correspond to observations in the workfile
Understanding these different classes of observations is important to understanding what EViews will show when drawing a geomap.
By default, EViews will show all of the shapes in the shapefile, whether or not they correspond to an observation in the workfile. You may restrict the display of these shapes in the following fashion:
• You may instruct EViews to filter out shapes corresponding to observations that are not in the current sample by pressing on button.
(Note that when a sample filter is applied, all shapes not associated with observations will also be hidden).
To remove the filter, press the button again to toggle the settings.
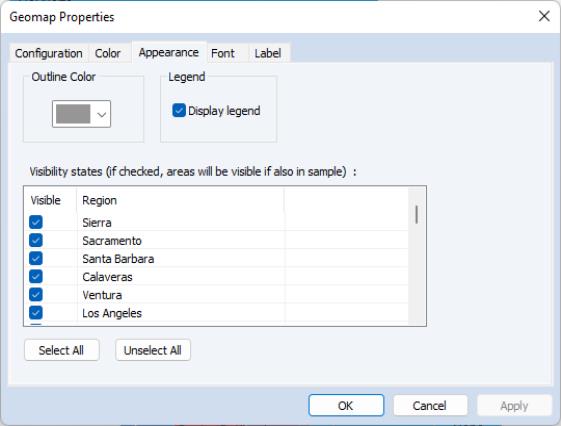
• Additionally, you may instruct EViews to hide specific shapes by clicking on the button and selecting the tab:
Simply check and uncheck the shape regions as desired. Note that the label for each of the shapes is taken from the label setting as described in
“Labeling the Shapes”.
Lastly, note that if you have applied a workfile sample filter, a shape region must satisfy both the sample filter and the settings filters. Thus, if an observation is in the current sample, but it’s checkbox is unchecked, it will be hidden. Likewise, if a shape’s checkbox is selected, but the observation is not in the current sample, it will be hidden.
Additional Appearance Settings
In addition to allowing you to show and hide specific shapes, the tab has settings for the shape outline color (, and whether to show a colormap legend ().