General EViews Interface
New Panes and Tabs User Interface
The familiar EViews multiple window interface offers users many advantages, especially on large computer screen displays. In some small screen settings, however, it can be more difficult to utilize fully the advantages of having multiple windows open at the same time.
EViews 13 offers an alternative user interface mode that employs panes and tabs in places of multiple windows. To maximize the use of space on smaller screens, the pane and tab mode offers a more organized way of displaying and grouping windows. The built-in organization properties of this interface may be ideally suited to smaller display environments.
In the pane and tab UI mode, different types of windows will appear in docked or undocked panes inside and outside the EViews frame:
• Workfiles, programs, and database windows appear as panes that can be docked in different locations, grouped together, toggled to automatically hide or display, and float outside the EViews frame
• Object windows will appear as tabbed windows using all available client area inside the EViews frame. Multiple object windows appear as different tabs, and these tabs can be divided and stacked separately to view multiple objects simultaneously.
When you open multiple workfiles or multiple programs, previously opened windows will appear as tabs in the corresponding docks. You may bring focus to a specific window by clicking on the corresponding tab.
When you open multiple object windows, the previously opened windows will appear as tabs in the object pane. You may bring focus to an object by clicking on the down arrow at the upper right of the object dock and selecting the desired object, or by selecting from the main EViews menu and clicking on the object name in the list of opened objects.
To further maximize screen real estate, you may place the workfile/database and the program panes in drawers. Placing a pane in a drawer temporarily hides the pane while retaining quick, on-demand access to the pane:
• Click on the pin icon at the top of a docked pane to hide it in a drawer on the side of the window. The pane window will close and be replaced by a drawer label on the side of the window.
• Hovering the cursor over the drawer label will open the drawer and display the pane window. Clicking away from the pane will close the drawer.
• Click again on the pin to remove the pane from the drawer and open the docked pane window.
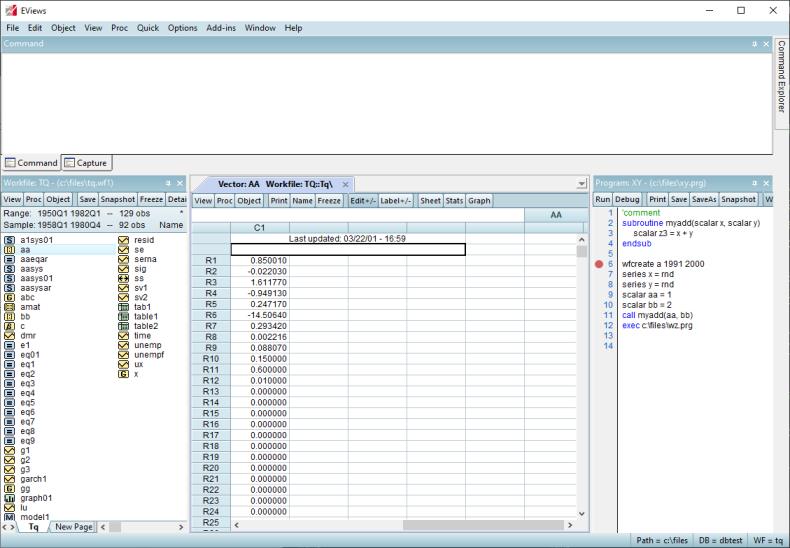
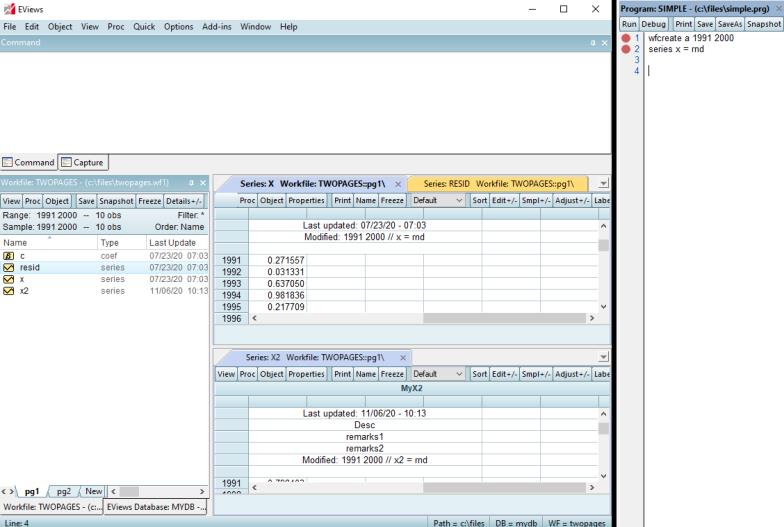
In the example screenshot, a workfile window and a database window are grouped together into a single pane (docked to the left) and the program window is floating outside the EViews frame on the right. Three object windows are also open in the center, with the X and RESID object windows grouped together and the X2 window stacked below them.
To enable or disable the pane and tab mode, click on and select the checkbox to enable the new mode:
New Window Options
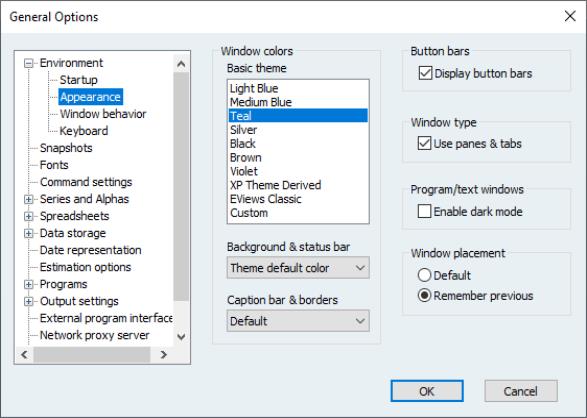
The dialog offers new settings to change the background of text and program windows, and to remember window placement between EViews sessions.
Dark mode
You may use the checkbox to control the background in program and text windows.
Remember window placement
The layout positions of primary windows (workfiles, programs, and database windows) can now be remembered between EViews sessions. This is especially useful in Pane & Tab mode (
“New Panes and Tabs User Interface”) since primary windows may be positioned outside the EViews frame in that mode.
To remember positions, simply select the radio button.
For each primary file, layout settings are stored in a hidden text file using the original name, but with the extension “.evsettings”. If you share both the primary file and the layout file with others, the original layout will be restored upon opening the primary file.
Note that when restoring window positions, complicated layouts such as panes grouped together may not appear exactly as before, especially if the layout is dependent on the existence of other panes.
Program Debugging
EViews offers tools for debugging to help you locate the source of problems. These tools allow you to run programs until they hit breakpoints on specific lines and then examine the state of your workfile at those breakpoints.
Setting and Clearing Breakpoints
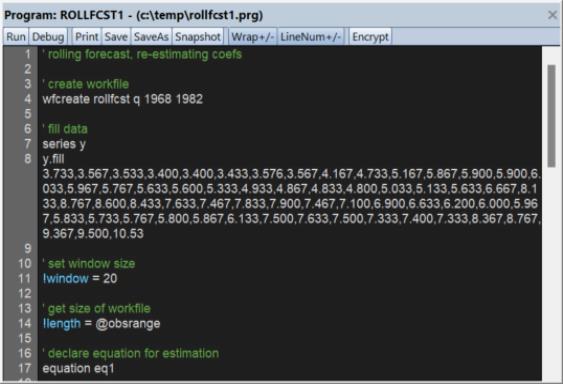
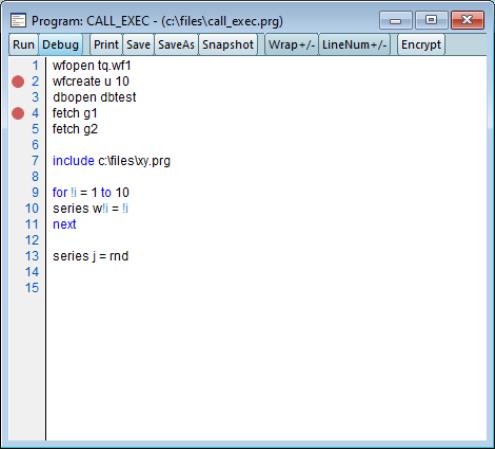
Open the EViews program file and set the breakpoint by clicking to the left of the desired line. A red dot will appear:
Clicking on a red dot clears that breakpoint.
Starting a Debugging Session
To begin debugging the program, click the button in the toolbar and enter any program arguments, choose whether to , and if desired change the . Click on .
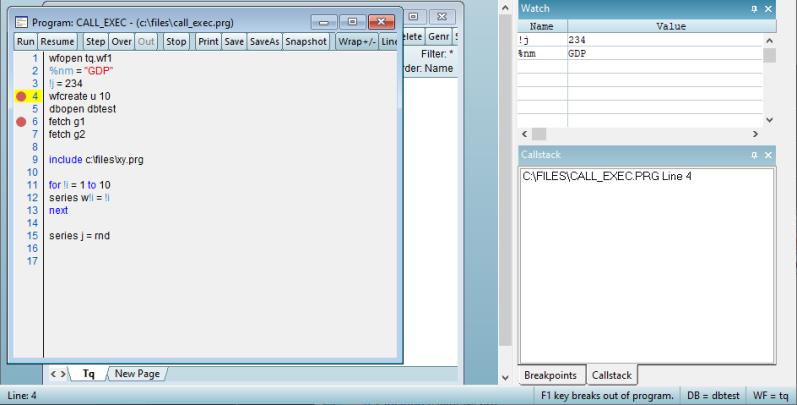
EViews will start program execution and open the debugging pane. There are three tabs in the pane: , , and .
Stopping at a Breakpoint
When the program reaches an active breakpoint, the execution will pause at the red dot, now highlighted in yellow:
At this point you can look at the , or windows for more information.
• shows all defined breakpoints. Toggling the checkbox next to a breakpoint name inactivates or reactivates it.
• displays the current line of the active files and subroutines of the program.
• presents the values of program and replacement variables.
Additionally, you may open EViews objects such as series or equations to examine their current states.
Button Bar
continues program execution until the next breakpoint is reached. executes the current line. continues program execution to completion, ignoring any remaining breakpoints. cancels program execution.
Restrictions during Debugging
During a debugging session, you will not be able to close any windows opened by the program since this could negatively affect its execution.
Program Dependency Logging
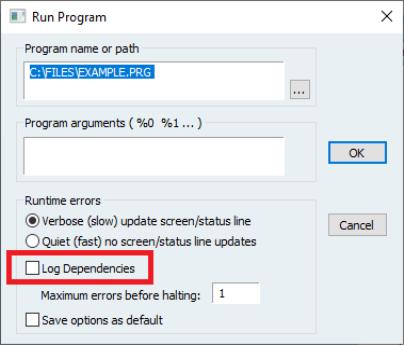
EViews allows you to automatically log a program’s external dependencies: files (as workfiles, Excel files, CSV files, etc), databases, and other programs (as includes and execs). To use it, check the checkbox in the dialog:
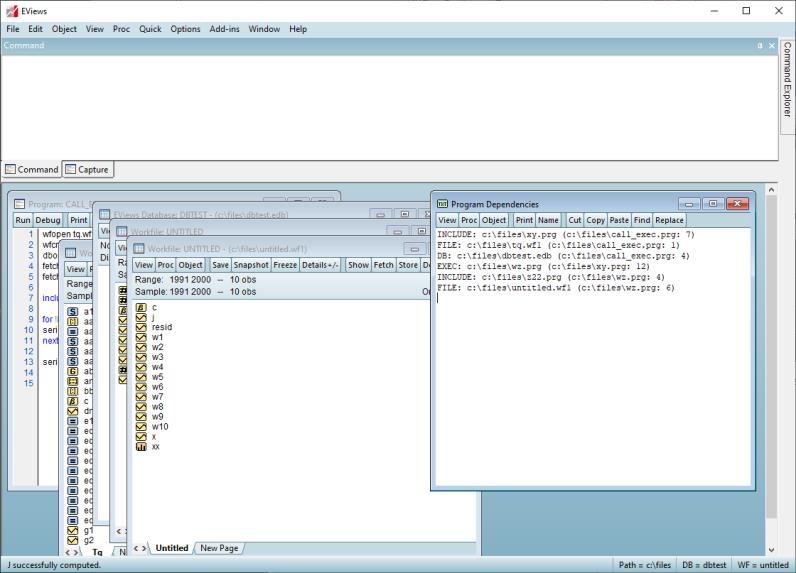
A new window will appear showing the type, filename, and path of all the external dependencies detected during the run.
The above image shows the dependence on the external program files “xy.prg,” “wz.prg,” and “z22.prg,” the workfiles “tq.wf1” and “untitled.wf1,” and the database “dbtest.edb,” along with the line numbers producing these dependencies.
Jupyter Notebook Support
Jupyter is a popular free, open-source, web-based interactive development environment that allows users to create notebooks for documenting computational workflow. A notebook consists of an ordered series of input and output cells for the organization of code, explanatory text, and multimedia in a single document. The chronological, narrative record-keeping a notebook allows for are useful for analysis, reporting, teaching, documentation, and many other purposes.
The code in a notebook cell is passed to a programming language specific “kernel” on the backend that does the code execution. EViews, starting with version 13, can be used as a Jupyter kernel. Users can run an EViews program and display its results from within a notebook.
Using the EViews Jupyter Kernel
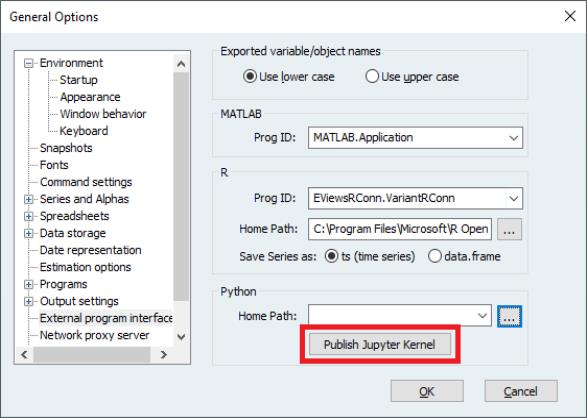
After Python and Jupyter have been installed (https://jupyter.org/), make the EViews kernel available to Jupyter by going to the main EViews menu and selecting . Click the button.
A new EViews-specific folder will be created in the Jupyter kernels folder location, usually found at “%AppData%/Roaming/jupyter/kernels”.
Next, run the notebook server. Depending on your installation, this can be done from a command prompt or the start menu in Windows or from Anaconda Navigator. Select the EViews kernel by choosing it from the “New” drop-down menu in the upper-right corner of the notebook dashboard. This will open the notebook editor, the interface where code and other input is entered and evaluated. Type EViews commands into the cells and run them with shift-enter (to run the current cell and select the following cell) or ctrl-enter (to run the current cell). More information on using Jupyter can be found in the Jupyter documentation (
https://jupyter-notebook.readthedocs.io/en/stable/notebook.html).