Background
Each test procedure described below involves the specification of a null hypothesis, which is the hypothesis under test. Output from a test command consists of the sample values of one or more test statistics and their associated probability numbers (p-values). The latter indicate the probability of obtaining a test statistic whose absolute value is greater than or equal to that of the sample statistic if the null hypothesis is true. Thus, low p-values lead to the rejection of the null hypothesis. For example, if a p-value lies between 0.05 and 0.01, the null hypothesis is rejected at the 5 percent but not at the 1 percent level.
Bear in mind that there are different assumptions and distributional results associated with each test. For example, some of the test statistics have exact, finite sample distributions (usually
t or
F-distributions). Others are large sample test statistics with asymptotic

distributions. Details vary from one test to another and are given below in the description of each test.
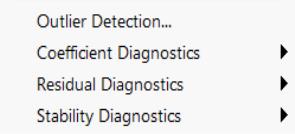
The button on the equation toolbar gives you a choice among four categories of tests to check the specification of the equation. For some equations estimated using particular methods, only a subset of these categories will be available.
Additional tests are discussed elsewhere. These tests include unit root tests (
“Performing Unit Root Tests in EViews”), the Granger causality test (
“Granger Causality” ), tests specific to binary, order, censored, and count models (
“Discrete and Limited Dependent Variable Models”), and the tests for cointegration (
“Testing for Cointegration”).