Data Handling
Daily Data Seasonal Adjustment
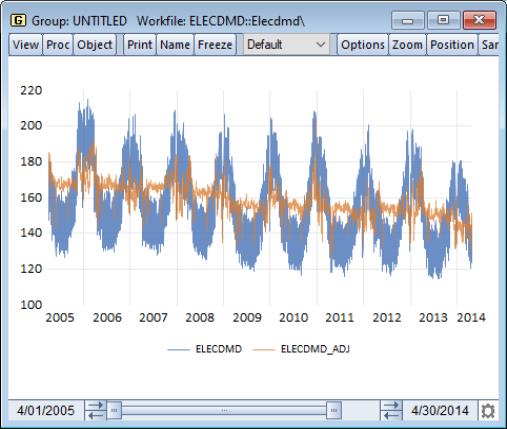
EViews 13 adds the ability to perform seasonal adjustment on daily data, by featuring an extended implementation of the seasonal adjustment of daily time series algorithm of Ollech (2021). Although the original Ollech (2021) algorithm is designed for 7-day week daily data, EViews’ implementation handles both 7 and 5-day week daily data.
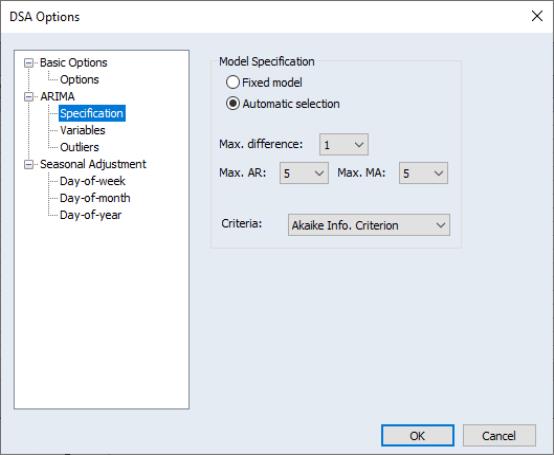
To perform DSA seasonal adjustment in EViews, open the series and select EViews will then open a tree-structured DSA dialog to allow you to set the options for the DSA procedure:
The branches of the tree, on the left, allow you to specify the , the model, and the three STL components. Click on the node name in the left to select the node.
New Excel File Writing Engine
Previous versions of EViews used the Excel application itself to write Excel 2007 files (.XLSX) so that exporting data from an EViews workfile to an Excel 2007 file required that Excel be installed on your machine. Using Excel to write these files was convenient, but importantly came with performance and capability limitations.
EViews 13 introduces a new Excel 2007 writing engine that no longer requires installation of the Excel application. Notably, with Excel 2007 writing,
• exporting EViews data to Excel is now much more efficient, especially when performing a large number of writes,
• you may now write data into an existing Excel file (via command), an operation that was not permitted in earlier versions,
• you may now choose between using EViews cell formatting, retaining the pre-existing (in Excel) formats, or removing all formats (colors, font, number formatting, column widths and row heights) for the written range.
• For the most part, using the new engine will be transparent to users for previous versions (apart from the performance improvements). Simply perform your Excel 2007 writes in the usual fashion using the option “mode=update”. The command,
tab1.save(t=excelxml, cellfmt=EViews, mode=update) mytable range=Country!b5
will add the contents of table TAB1 to the preexisting “MyTable.XLSX” Excel file. The data will be written to the ‘Country’ sheet at cell B5. All preexisting cell formatting in the Excel file will be overwritten using the cell colors and fonts in TAB1.
Holiday Functions
The @holiday and @holidayset functions allow you to analyze and account for different behavior on holiday days, around the world. These functions may be used to create series that indicate the proportion of an annual event covered by each observation.
The @holiday function returns the proportion or identifier of an annual event covered by the observation, for each observation in the workfile.
The basic syntax for the holiday function is
Syntax: @holiday(h[, b][, flag...])
h: string
b: string
flag: (optional) string
Return: series
where h is the holiday event specification, b is a basis specification, and flag is a calculation scaling flag.
The @holidayset function returns the proportion or identifier of multiple annual events covered by the observation, for each observation in the workfile.
@holiday is similar to @holidayset, but allows for the specification of holidays using a range pair of dates, while disallowing multiple holiday event specifications.
The basic syntax for the holiday set function is
Syntax: @holidayset(h[, b][, flag...])
h: string
b: string
flag: (optional) string
Return: series
where h is one or more holiday event specifications, b is a basis specification, and flag is a calculation scaling flag.
@holiday Examples
The command
series jan1 = @holiday("Jan1")
generates a series containing a non-zero value only for those observations associated with January 1st. For a daily or lower frequency workfile, only a single observation will cover January 1st each year and that observation will have a value of 1. For a higher frequency workfile, multiple observations will cover January 1st and thus have a value less than one. For example, in an intra-day workfile with a frequency of six hours, each of the four observations for January 1st every year will have the value 0.25.
series jan1early = @holiday("Jan1", "Mon-Sun,9AM-2PM")
generates a series that is non-zero only for those observations associated with January 1st and between the hours of 9AM (inclusive) and 3PM (exclusive). For an intra-day workfile with a frequency of six hours, the two observations for January 1st that begin at 6AM and noon each year will have the value 0.5. Note that the end time of the basis specification, e.g. 2PM, is considered to extend to the last moment of the specified time, thus 2PM is interpreted as 2:59:59.999PM (3PM rather than 2PM).
series mondays = @holiday("Nov1Mon(1)")
generates a series that is non-zero only for those observations that fall on the day after the first Monday in November, i.e. the Tuesday that is US federal Election Day.
series frenchlabor = @holiday("Labour.fr~")
Generates a series that is non-zero only for those observations associated with French Labor Day (May 1st). Should that day fall on a Saturday, the observation(s) for the preceding Friday will be non-zero instead, or if that day falls on a Sunday, the observation(s) for the following Monday will be non-zero. For example, in a daily workfile covering years 2020 through 2024, the observations for Friday May 1 2020, Friday April 30 2021, Monday May 2 2022, Monday May 1 2023, and Wednesday May 1 2024 would have the value 1.
series canadaday = @holiday("Canada!")
generates a series that is non-zero only for those observations associated with Canada Day (July 1st). Should that day fall on a Saturday or a Sunday, the observation(s) for the following Monday will be non-zero instead. For example, in a daily workfile covering years 2022 through 2024, the observations for Friday July 1 2022, Monday July 3 2023, and Monday July 1 2024 would have the value 1.
series lunar = @holiday("LNY~(-3)")
generates a series that is non-zero only for those observations occurring three days before the Lunar New Year, adjusted for weekends. For example, in a daily workfile covering year 2020, while the nominal date for the holiday is Saturday January 25, the observation for Tuesday January 21 would have the value 1 as a consequence of the weekend modifier and offset.
series newyears1 = @holiday("NewYears[1,2,0]")
generates a series that is non-zero only for those observations associated with New Year's Day (January 1st) and the preceding day (December 31st). In the common case where those two days will be covered by different observations, the observation for December 31st will have the value 0.33 and the observation for January 1st will have the value 0.67 given the relative weights specified.
series newyears2 = @holiday("NewYears[1,2,0]","denorm")
generates a series that is non-zero only for those observations associated with New Year's Day (January 1st) and the preceding day (December 31st). With the use of the “denorm” option, the observation for December 31st will have the value 1 and the observation for January 1st will have the value 2.
series ukbank = @holiday("Bank.uk!")
generates a series that is non-zero only for those observations associated with United Kingdom bank holidays included in the “bank.uk” named group. The weekend modifier “!” is applied to each individual holiday in the group.
series postvets = @holiday("Veterans.us(7) Thanksgiving.us")
generates a series that is non-zero only for those observations between a week after US Veterans Day and US Thanksgiving. This range normally covers between five to eleven days, depending on the year. For example, in 2020 this range covers nine days (November 18 through November 26), thus in daily workfile the observations associated with those days would have the value 0.111.
@holidayset Examples
The command
series jan1set = @holidayset("Jan1")
generates a series containing a non-zero value only for those observations associated with January 1st. For a daily or lower frequency workfile, only a single observation will cover January 1st each year and that observation will have a value of 1. For a higher frequency workfile, multiple observations will cover January 1st and thus have a value less than one. For example, in an intra-day workfile with a frequency of six hours, each of the four observations for January 1st every year will have the value 0.25. Since only a single holiday is specified, this function behaves identically to @holiday.
series vetsset = @holidayset("Veterans.us(7) Thanksgiving.us")
generates a series that is non-zero only for those observations a week after US Veterans Day and on US Thanksgiving. For example, in 2020 the two holidays occur on November 18 and November 26, thus in daily workfile the observations associated with those days would each have the value 0.5. Note that unlike the @holiday function, the two holidays included are distinct and do not specify a range.
series easterset = @holidayset("Easter Unity.de[ramp(3)] Oct31~")
generates a series that is non-zero only for those observations associated with Easter, the five days on and around German Unity Day, and Halloween, adjusted for weekends. For example, in a daily workfile covering year 2020, the observation for Sunday April 12 will have the value 0.333, the observations for Thursday October 1 through Monday October 5 will have the values 0.037, 0.074, 0.111, 0.074, and 0.037, respectively, and finally the observation for Friday October 30 will have the value 0.333.
Updated X-13 Engine
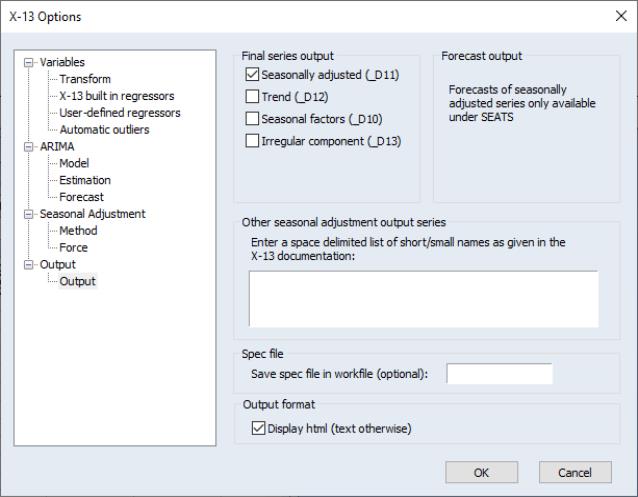
EViews has updated the version of the Census X-13 executable to support HTML output. The current version will be newer than Version 1.1, Build 59.
The updated X-13 engine allows you to save your X-13 output directly to HTML. Click on the node in the tree, and make sure the checkbox is selected:
Note that the Census Bureau has tested this version of X-13ARIMA-SEATS on Windows 10 and indicates that it may work on previous Windows versions.
SDMX Databases
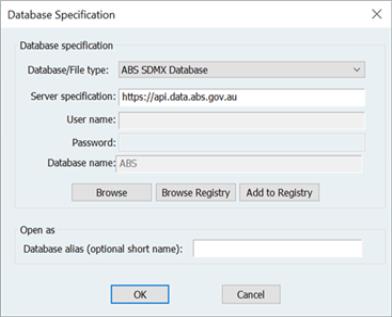
As part of EViews support for SDMX Databases, EViews 13 now offers access to Australian Bureau of Statistics (ABS) SDMX, Deutsche Bundesbank (DB) SDMX, and Insee (L’Institut national de la statistique et des études économiques) SDMX data.
Please note that an internet connection is required to obtain SDMX online data. For more information on the ABS, DB, or Insee data, see:
EViews offers a custom browser for navigation to and retrieval of available data from SDMX databases. To start, open a database window by selecting from the main EViews menus, then select , , , , or from the dropdown menu. A dialog similar to the one below will be displayed:
Click to open the standard EViews database window. Click on or to open a custom database.
For example, this is the interface to the Eurostat data:
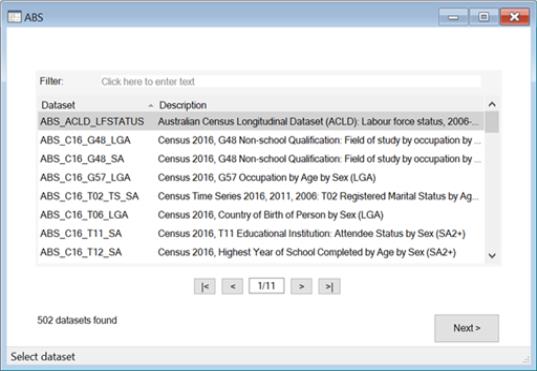
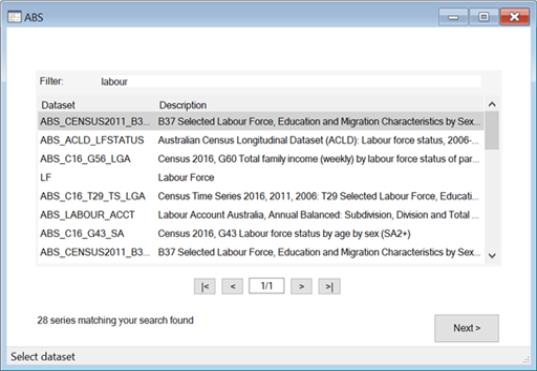
The dialog allows data to be selected from within datasets; alternatively, the browser interface is a way to search through the datasets by typing a keyword in the textbox:
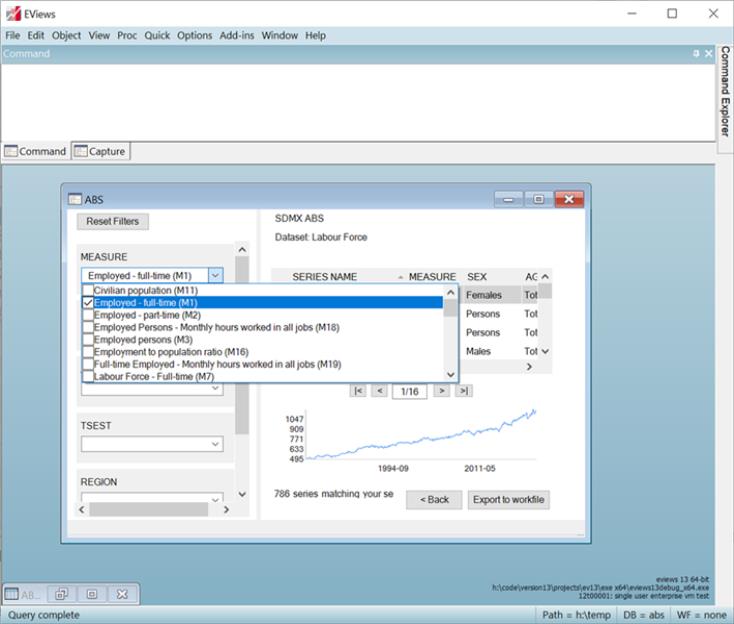
Select a dataset and click to display a dialog for viewing and selecting series:
The dialog contains a table with all of the series matching the search. On the left is an interface with a list of dropdown boxes containing additional search filter criteria. Click a box or boxes to select one or more options. If more filter criteria are selected the results on the right will be updated to match the new selections. On the bottom right is a graph preview of the series data selected.
Once the selection process is finished, drag-and-drop or click the button to export the series directly into a new or existing workfile.
Trading Economics Databases
Trading Economics provides access to a large range of historical and forecast data for economic indicators, stock markets, government bonds, exchange rates, and commodity prices.
Please note that an internet connection is required to obtain Trading Economics online data. For more information on Trading Economics data subscriptions, please see:
Additionally, direct access to Trading Economics online data is only offered in the EViews Enterprise Edition.
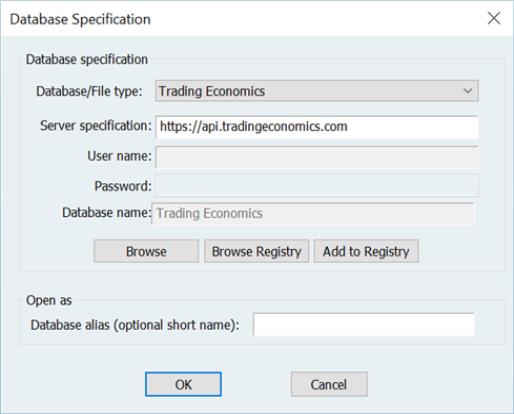
EViews offers a custom interface to Trading Economics data. To open the database, select from the main EViews menu and then select from the dropdown menu:
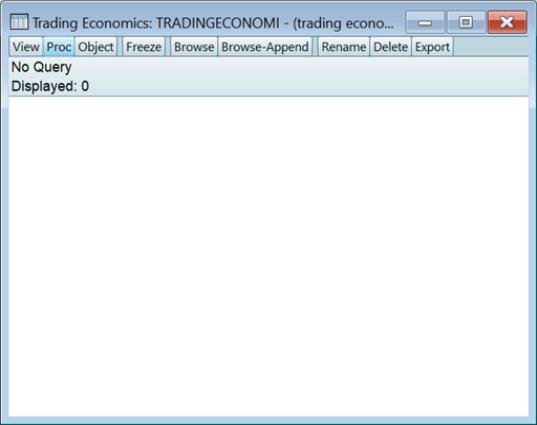
Click to open the standard EViews database window:
Click on in the toolbar to open the custom Trading Economics window:
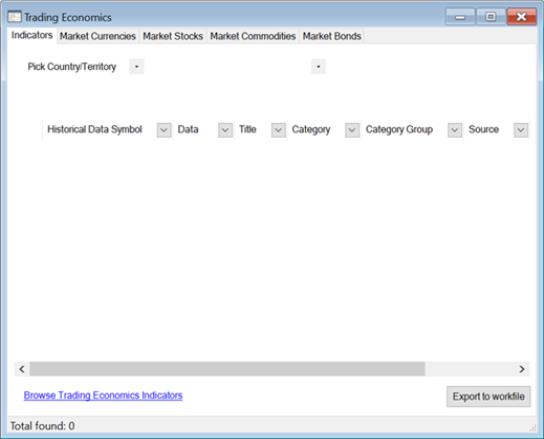
The dialog interface displays five tabs, or categories, of data: , , , , and
Indicators
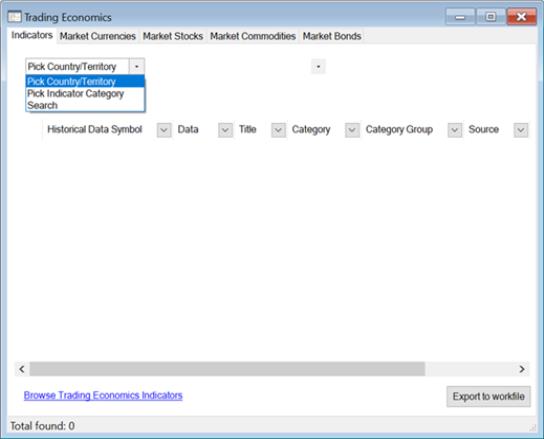
Under the tab, choose between picking a country/territory, an indicator category, or a search:
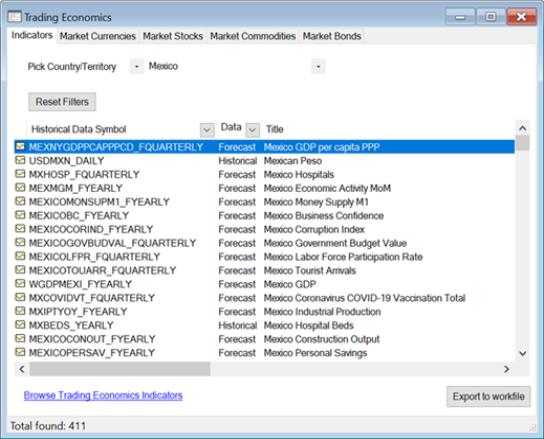
For select a country from the drop-down box to see historical and forecast indicators:
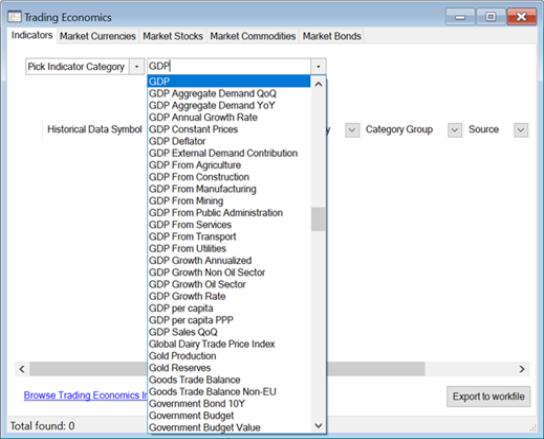
For Pick Indicator Category, select a category from the drop-down box to see historical and forecast indicators:
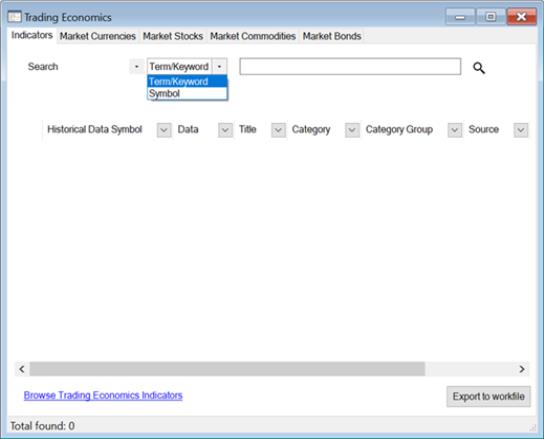
For , select or and enter an expression in the text box:
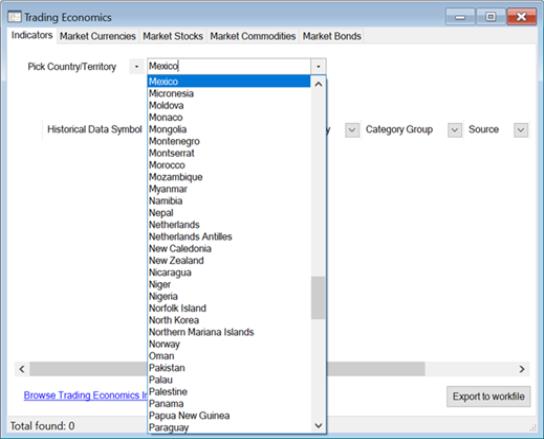
The user interface provides a way to filter through the results regardless of the method chosen. After picking the country Mexico, for example, the dialog displays a table with the indicator results:
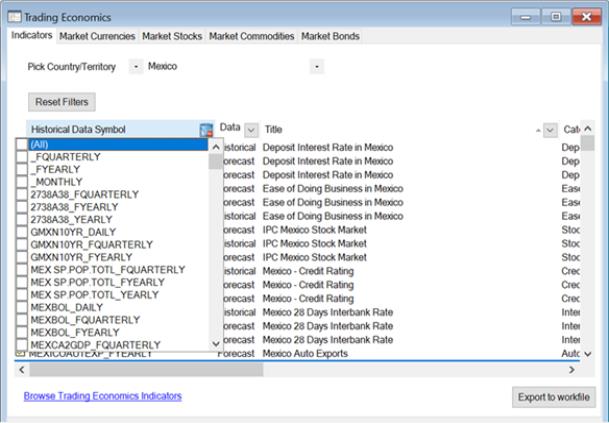
Click the drop-down box next to each column header to show a set of filter checkboxes. Select one or more of these to display selected values or select to show all values. Click to clear all filters.
Markets
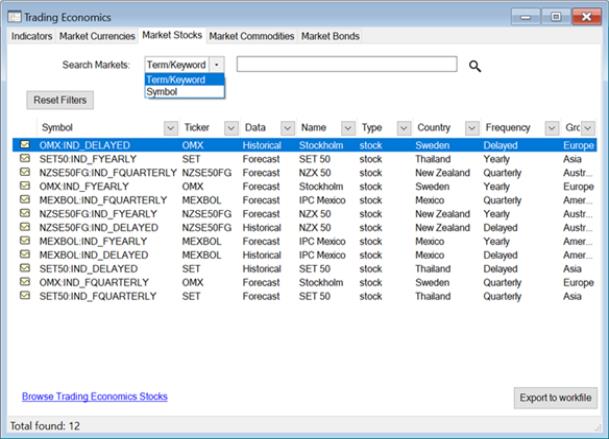
If any of the market tabs (, , , ) are selected, the dialog will display a table with all the stock market symbol results you have permission to see based on your subscription. For example, the below dialog shows the tab:
You may elect to search for a or a . Once the series of interest is found and selected, drag-and-drop or click the button to export the series directly into a new or existing workfile.
For more information click the link at the bottom of the dialog to open the Trading Economics webpage.
World Health Organization Databases
World Health Organization (WHO) provides access to a large range of health-related data and statistics. An internet connection is required to obtain WHO online data.
For more information on data subscriptions, please see:
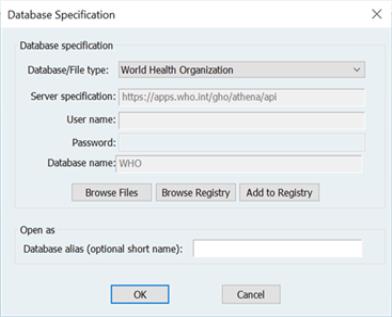
EViews offers a custom interface to World Health Organization data. To open the database, select from the main EViews menu and select from the dropdown menu:
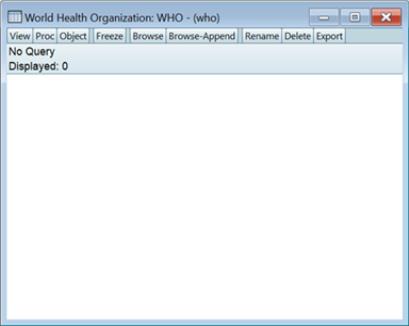
Click to open the standard EViews database window:
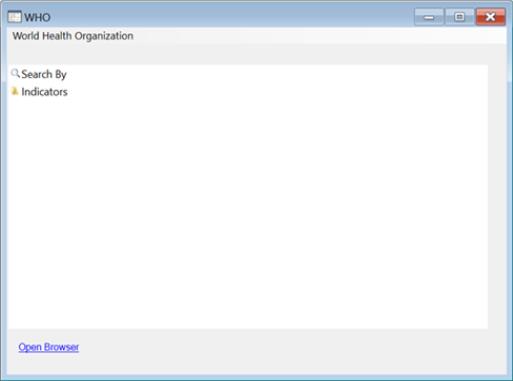
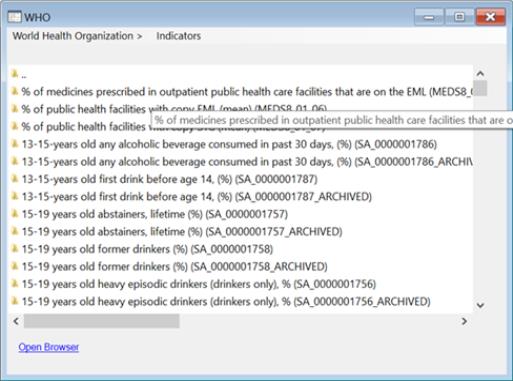
Click on in the toolbar to open the custom WHO window:
Click on the folder and navigate through the set of nested folders:
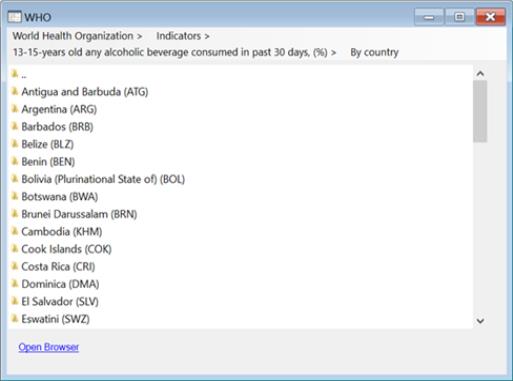
Click on a folder to open its subtopics:
The full path of the active folder is shown in the header. Click on any folder within the path to return to it. For example, clicking on will move up a single level to show the country choices. Similarly, clicking on “..” in the window listing will move up a single level.
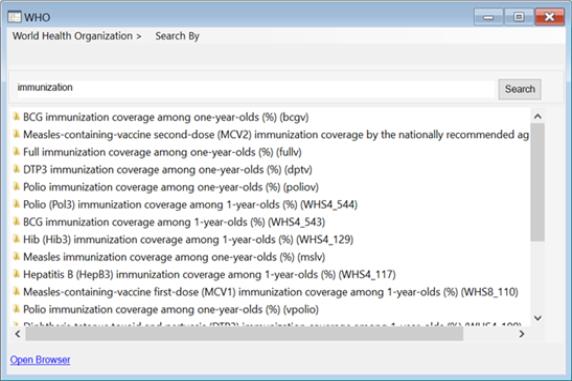
Alternately, click on to search for a keyword:
Once the series of interest is selected, drag or copy it into a workfile. For more information, click the link at the bottom of the dialog to open the WHO website.
Simplified Matrix Data Access
EViews 13 offers a useful set of tools for extracting parts of matrices for further use. Some of the functions described below are available in limited form in prior versions of EViews, but the new additions round out the set of functions for accessing data, allowing for easy-to-use operations that were previously difficult to perform.
Useful Matrix Utility Functions
There are five new or updated utility functions that are particularly useful for working with matrix data.
Briefly:
• @fill(n1, n2, n3, ...) – return a numeric vector with the specified values.
• @range(n1, n2) – return a numeric vector with the sequential integer values from n1 to n2.
• @seq(s, d, n) – return a numeric vector with the arithmetic sequence of n elements beginning with s and incrementing by d.
• @grid(n1, n2, n3) – return a numeric vector containing a grid of n3 values from n1 to n2.
• @sfill("str1", "str2", "str3", ...) – return a svector using the specified double-quote enclosed strings.
Note that the first three functions create vector objects, while the latter creates an svector (string vector) object.
These functions are straightforward in intention. While @fill and @seq will work with arbitrary numeric values, we are interested here in their use in generating vectors of integer values.
vector x1 = @fill(1, 2, 4, 5, 7)
creates the vector with elements {1, 2, 4, 5, 7}, while
vector x2 = @range(1, 5)
creates the vector with elements {1, 2, 3, 4, 5}, while
vector x3 = @seq(1, 2, 4)
creates the vector with elements {1, 3, 5, 7}, while
vector x4 = @grid(1, 2, 6)
creates the vector with elements {1.0, 1.2, 1.4, 1.6, 1.8, 2.0}, and
svector sx1 = @sfill("apple", "pear", "orange")
creates the svector with the values {“apple”, “pear”, “orange”}.
Matrix Extraction Data Members
The best way to extract data from a matrix object is to use matrix object member functions.
Some of these member functions were available for selected objects in earlier versions and some are new in EViews 13. All of the functions have enhanced scope in EViews 13 along with new functionality for referencing data using matrix row and column labels.
The relevant functions for all matrix objects are:
• obj.@col(arg) – returns matrix object containing column(s) of obj associated with arg
• obj.@row(arg) – returns matrix object containing row(s) of obj associated with arg
• obj.@sub(arg1, arg2) – returns matrix object containing row(s) and col(s) of obj associated with arg1 and arg2, respectively
• obj.@dropcol(arg) – returns matrix object containing column(s) of obj not associated with arg
• obj.@droprow(arg) – returns matrix object containing row(s) of obj not associated with arg
• obj.@dropboth(arg1, arg2) – returns matrix object containing row(s) and col(s) of obj not associated with arg1 and arg2, respectively
For symmetric matrices, we also have the functions
• obj.@sub(arg) – returns sym object containing row(s) and col(s) of obj associated with arg, respectively
• obj.@dropboth(arg) – returns sym object containing row(s) and col(s) of obj not associated with arg, respectively
where
• obj is the name of a matrix object in the workfile
• arg, arg1, arg2 are integers, scalar objects, vectors, strings, or svectors
For cases where args are numeric (integers, scalars, vectors), the arg values act as row or column indices. Focusing on column functions, for example,
vector v1 = x.@col(3)
matrix m1 = x.@col(cid)
where X is a matrix and CID is a vector of column indices, and the two lines return the vector V1 and matrix M1 containing the 3rd column of X, and the columns of X referenced in CID, respectively. Note that the elements of CID must be integers from 1 to the number of columns of X.
For cases where
args are strings (string literal, string object, svector), the arg values are examined to find matches in the corresponding row or column labels (
“Matrix Row and Column Labels”). For example, the commandsvector v2 = x.@col("apple")
matrix m2 = x.@col(scid)
where SCID is a svector of strings, produce the vector V2 and matrix M2 containing the 3rd column of X, and the columns of X with labels that match the elements of SCID, respectively. Note that all of the elements of SCID must be strings that match the column names previously assigned to X.
You may mix the types of arg1 and arg2 in data member functions that take two arguments so that, for example,
matrix m3 = x.@sub(3, "apple")
returns M3 containing the element of X in row 3 and column with label “apple”.
Similarly, the commands
matrix v1d = x.@dropcol(3)
matrix m1d = x.@dropcol(cid)
matrix v2d = x.@dropcol("apple")
matrix m2d = x.@dropcol(scid)
matrix m3d = x.@dropboth(5, "apple")
return the matrix objects
• V1D, the matrix X with column 3 dropped
• M1D, the matrix X with columns referenced by CID dropped
• V2D, the matrix X with the column with label “apple” dropped
• M2D, the matrix X with the columns with labels in SCID dropped
• M3D, the matrix with the row 5 dropped and the column labeled “apple” dropped
The special symmetric matrix versions of these functions return syms:
sym sym1 = symorig.@sub(cid)
sym sym2 = symorig.@dropcol(3)
sym sym3 = symorig.@dropcol(cid)
return the sym objects
• SYM1, the columns (and corresponding rows) of SYMORIG referenced by CID
• SYM2, the contents of SYMORIG after dropping column and row 3
• V2D, the contents of SYMORIG after dropping columns and rows referenced by CID
Matrix Extraction with Utility Functions
Combining matrix utility functions (
“Useful Matrix Utility Functions”) with the matrix extraction data members offers flexible methods for obtaining data from matrices.
Consider, for example, the extraction of multiple columns from the matrix X using the @col data member function:
vector xid = @fill(1, 3, 5, 9)
matrix xsub = x.@col(xid)
extracts columns {1, 3, 5, 9} from the matrix X.
Since the args in the member data extraction functions may themselves be expressions, we may combine the two lines into a single expression:
matrix xsub1 = x.@col(@fill(1, 3, 5, 9))
Similarly, extracting or dropping the 7 through 9th columns of X may be done using
matrix xsub2 = x.@col(@range(7, 9))
matrix xsub3 = x.@dropcol(@range(7, 9))
We can perform the same compound extractions in 2-dimensions, as in
matrix xsub4 = x.@sub(@range(3, 6), @sfill("apple", "orange"))
matrix xsub5 = x.@dropboth(4, @sfill("apple", "orange"))
which create XSUB4 containing rows 3 to 6 and columns with labels matching “apple” and “orange” of X, and XSUB5 containing X after dropping row 4 and the columns with matching labels.
New Matrix Import/Export Engine
An all new matrix data engine makes it easier than ever to get data into and out of external data sources and offers improved support for different data formats.
Import Data into Matrix objects
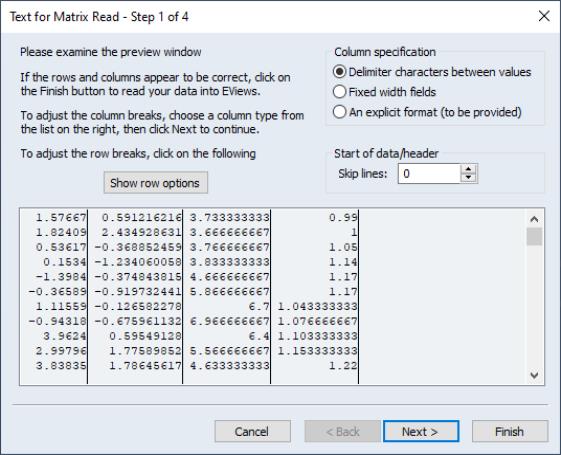
You may now read directly into an EViews matrix object (matrix, vector, sym, etc.) from text (both ASCII and binary), HTML, Excel XLSX, and Excel 97 XLS files. Excel reads includes support for named ranges and multiple pages. The new engine supports a number of different formats, and features EViews interactive data import wizard which walks you step-by-step through the data import, providing fine-tuned control of the pending import, previews of the final data, and command capture.
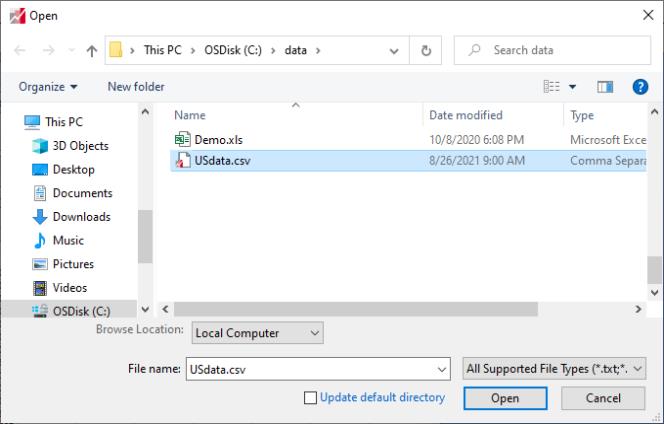
To read data into a matrix object open the matrix and select EViews will open the standard file dialog prompting you to select a file:
Double-click to select the file, or highlight the file and click on . EViews will open a data import wizard:
Proceed through the steps of the wizard by filling out the desired values and clicking on , and click on when ready to import the data. EViews will read the data into the matrix object, resizing the object to match the source size, if possible.
Note that some matrix objects offer some challenges in data import. If you have a vector import from multi-column data,
• See
Matrix::import for representative command documentation. Equivalent functions are available for vector, sym, rowvector, and coef objects.
Export Data from Matrix Objects
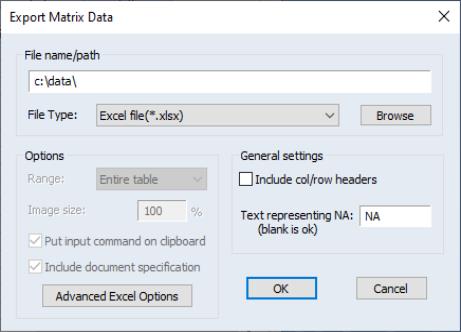
When you are ready to export data from a matrix object, EViews 13 allows you to write to a number of formats including the various ASCII, binary, HTML, RTF, and Excel formats, along with LaTeX, Markdown, and PDF files. Importantly, the Excel XLSX export allows you to write the matrix results into existing Excel files, beginning at a specified cell.
To write the contents of the matrix, select from the matrix menu:
Enter a file name in the edit field, or to select a file.
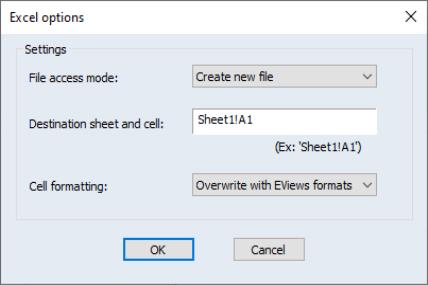
You may change the to transpose the data prior to write, provide options related to the target file type, such as for XLSX,
which permit writing into an specific sheet and cell of a new or existing file, with or without formatting.
• See
Matrix::export for representative command documentation. Equivalent functions are available for vector, sym, rowvector, and coef objects.
Matrix Row and Column Labels
• labeling rows and columns in the spreadsheet
• referring to rows and columns of the matrix when accessing data
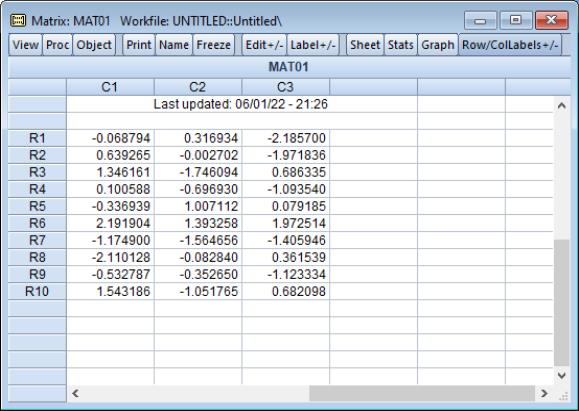
By default, there are no row and column labels in matrix objects. When spreadsheets show the contents of the matrix, the rows are labeled as “R1”, “R2”, etc., and the columns are labeled as “C1”, “C2”, “C3”, etc.
To define row and column labels, you may open a matrix object display the spreadsheet view:
By default, there are no labels defined, but you may use the matrix procs setrowlabels and setcollabels to assign new values:
For example,
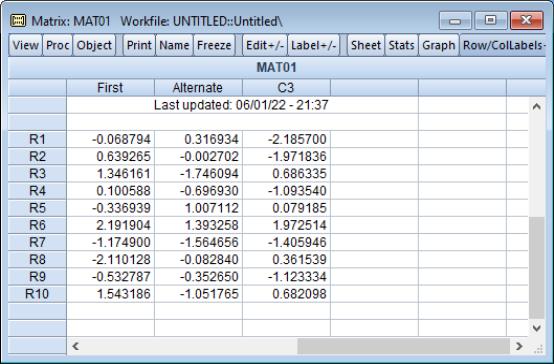
mat01.setcollabels "First" "Alternate"
sets column labels for the first two columns.
By default, these labels will be used in the spreadsheet display of the matrix:
The toggles on and off the display of the labels.
EViews 13 adds the ability to extract data from the matrices using the row and column labels. For example, with the matrix object, we have matrix data members,
@col(arg) Returns the columns defined by arg.
@dropcol(arg) Returns the matrix with the columns defined by arg removed
@droprow(arg) Returns the matrix with rows defined by arg removed.
@dropsub(arg1, arg2) Returns the matrix with the rows defined by arg1 and columns defined by arg2 removed.
@row(arg) Returns the rows defined by arg.
@sub(arg1, arg2) Returns the matrix with rows defined by arg1 and columns with defined by arg2.
that all take args that may be integers, vectors of integers, string, or svectors of strings. Importantly, integer values will correspond to row and column indices. while string values will correspond to previously defined row and column labels.
Thus, in our example from above,
vector vec1 = mat01.@col("Alternate")
will create the vector VEC1 containing the column labeled with “Alternate” in MATRIX01. This command is equivalent to
vector vec1 = mat01.@col(2)