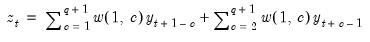
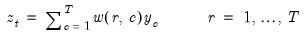
Series
Series of numeric observations. An EViews series contains a set of observations on a numeric variable.
Series Declaration
frml create numeric series object with a formula for auto-updating.
genr create numeric series object.
series declare numeric series object.
To declare a series, use the keyword series or alpha followed by a name, and optionally, by an “=” sign and a valid numeric series expression:
series y
genr x=3*z
If there is no assignment, the series will be initialized to contain NAs.
Series Views
bubbletest perform tests on the existence of a bubble in the series.
buroot carries out unit root tests which allow for a single breakpoint.
changepoints perform tests on a change in the location parameter (mean) of the series.
correl correlogram, autocorrelation and partial autocorrelation functions.
display display table, graph, or spool in object window.
dups duplicates display for observations in the series.
edftest empirical distribution function tests.
forceval evaluate different forecasts of a series, and perform the forecast combination test.
hist descriptive statistics and histogram.
label label information for the series.
lrvar compute the symmetric, one-sided, or strict one-sided long-run variance of a series.
pancov compute covariances, correlations, and other measures of association for a panel series.
panpcomp perform principal components analysis on a panel series.
seasuroot seasonal unit root test on an ordinary series.
sheet spreadsheet view of the series.
statby statistics by classification.
stats descriptive statistics table.
testby equality test by classification.
trendtests perform tests on the existence of a trend in the series.
uroot unit root test on an ordinary or panel series.
uroot2 compute dependent (second generation) panel unit root tests on a series in a panel workfile.
vratio compute Lo and MacKinlay variance ratio test, or Wright rank, rank-score, or sign-based forms of the test.
waveanova compute the wavelet variance decomposition of the series.
wavedecomp compute the wavelet transform of the series.
waveoutlier perform wavelet outlier detection for the series.
wavethresh perform wavelet thresholding (denoising) of the series.
Series Procs
adjust modify or fill in the values in a series.
autoarma forecast from a series using an ARIMA model with automatic determination of the specification.
bpf compute and display band-pass filter.
classify recode series into classes defined by a grid, specified limits, or quantiles.
clearcontents clear a contiguous block of observations in a series.
clearhist clear the contents of the history attribute.
copy creates a copy of the series.
distdata save distribution plot data to a matrix.
dsa seasonally adjust daily data using the DSA method.
ets perform Error-Trend-Season (ETS) estimation and exponential smoothing.
fill fill the elements of the series.
forcavg average forecasts of a series.
hpf Hodrick-Prescott filter.
insertobs shift the observations of the series up or downwards, inserting blank observations.
ipolate interpolate missing values.
jdemetra use the JDemetra+ seasonal adjustment routine on the series.
makepanpcomp save the scores from a principal components analysis of a panel series.
map assign or remove value map setting.
movereg seasonally adjust series using the movereg method.
olepush push updates to OLE linked objects in open applications.
prophet performs Facebook’s Prophet forecasting on the underlying series.
resample resample from the observations in the series
.
seas seasonal adjustment for quarterly and monthly time series.
setattr set the value of an object attribute.
setconvert set default frequency conversion method.
setfillcolor define the fill (background) color used in series spreadsheets.
setformat set the display format for the series spreadsheet.
setindent set the indentation for the series spreadsheet.
setjust set the horizontal justification for all cells in the spreadsheet view of the series.
settextcolor set custom spreadsheet text coloring for the series.
setwidth set the column width in the series spreadsheet.
sort change display order for series spreadsheet.
stl seasonally adjust series using the STL decomposition method.
x11 (deprecated) seasonal adjustment by Census X11 method for quarterly and monthly time series.
x12 seasonal adjustment by Census X12 method for quarterly and monthly time series.
x13 seasonally adjust series using the Census X-13ARIMA-SEATS method.
Series Graph Views
Graph creation views are discussed in detail in
“Graph Creation Command Summary”.
area area graph of the series.
bar bar graph of the series.
line line graph of the series.
qqplot quantile-quantile plot.
Series Data Members
String values
@attr("arg") string containing the value of the arg attribute, where the argument is specified as a quoted string.
@description string containing the Series object’s description (if available).
@depends string containing a list of the series in the current workfile on which this series depends.
@detailedtype string with the object type: “SERIES”, if an ordinary series, or “LINK”, if defined by link.
@displayname string containing the Series object’s display name. If the Series has no display name set, the name is returned.
@first string containing the date or observation number of the first non-NA observation of the series. In a panel workfile, the first date at which any cross-section has a non-NA observation is returned.
@firstall returns the same as @first, however in a panel workfile, the first date at which all cross-sections have a non-NA observation is returned.
@hilo string containing the series object’s high-to-low frequency conversion method.
@last string containing the date or observation number of the last non-NA observation of the series. In a panel workfile, the last date at which any cross-section has a non-NA observation is returned.
@lastall returns the same as @last, however in a panel workfile, the last date at which all cross-sections have a non-NA observation is returned.
@lohi string containing the series object’s low-to-high frequency conversion method.
@name string containing the Series object’s name.
@remarks string containing the Series object’s remarks (if available).
@type string with the object type: “SERIES”.
@updatetime string represent of the time and date at which the Series was last updated.
Scalar values
@obs scalar containing the number of non-NA observations.
(i) i-th element of the series from the beginning of the workfile (when used on the left-hand side of an assignment, or when the element appears in a matrix, vector, or scalar assignment).
Series Element Functions
@elem(ser, "j") function to access the j-th observation of the series SER, where j identifies the date or observation.
Series Examples
You can declare a series in the usual fashion:
series b=income*@mean(z)
series blag=b(1)
Note that the last example above involves a series expression so that B(1) is treated as a one-period lead of the entire series, not as an element operator. In contrast:
scalar blag1=b(1)
evaluates the first observation on B in the workfile.
Once a series is declared, views and procs are available:
a.qqplot
a.statby(mean, var, std) b
To access individual values:
scalar quarterlyval = @elem(y, "1980:3")
scalar undatedval = @elem(x, "323")
Modify or fill in the values in a series.
Syntax
series_name.adjust [transform] [operator] [values] [interpolation]
Follow the adjust keyword with an expression made up of a combination of transform, operator, values and interpolation components. transform is used to specify a transformation of the data to which the adjustment will be made. The operator contains a mathematical expression defining how you would like to adjust the values in the series. values contains the values used during that operation. Finally, the interpolation component specifies how any missing values in the values component should be filled in via interpolation.
All adjustments are made on the current workfile sample.
Transform
The following transformations are available. If a transformation is specified, any adjustments specified in the operator or interpolation components is made to the transformed data rather than the raw data.
| |
d | One period difference. |
dy | Annual difference. |
pch | One period percentage change. |
pcha | Annualized one period percentage change. |
pchy | Annual percentage change. |
log | Natural logarithm. |
dlog | One period difference of logged values. |
Operators
The following operators are available:
| |
= | Overwrites the existing value with the new value. |
+= | Adds the new value to the existing value. |
-= | Subtracts the new value from the existing value. |
*= | Multiplies the existing value by the new value. |
/= | Divides the existing value by the new value. |
=_ | Overwrites the existing value with the previous cell’s value. |
+_ | Add the new value to the previous observation’s value. |
-_ | Subtract the new value from the previous observation’s value. |
*_ | Multiply the previous observation’s value by the new value. |
/_ | Divide the previous observation’s value by the new value. |
\ | Reverse the order of the observations. Note this operator cannot be used with a values or interpolation component. |
Values
The values component should be made up of a space delimited set of values to use during the adjustment. In addition to single numbers, you may use the following keywords as part of the values component:
| |
. | A single value to be filled in by interpolation. |
# | Use the existing series value, unless it is an NA, in which case fill it by interpolation. |
NA | Insert an NA (which will not be filled by interpolation). |
Rint1[(int2)] | Repeats the previous value int1 times. You may optionally include a second number in parenthesis indicating how many of the previous values to repeat. |
.. | Interpolate between all remaining values. |
Interpolation
The interpolation component specifies how to fill in any missing values in the values component designated for interpolation. By default a cubic spline is used for interpolation. The other available choices are show below.
| |
__ (double underscore) | Repeats previous non-missing value. |
^ | Linear interpolation. |
~ | Cubic spline interpolation |
& | Catmull-Rom spline interpolation. |
^* | Log-linear (multiplicative) interpolation (linear in the log of the data). |
~* | Multiplicative cubic spline interpolation (a cubic spline on the log of the data). |
&* | Multiplicative Catmull-Rom spline interpolation (a Catmull-Rom spline on the log of the data). |
Examples
The following command replaces the first four observations in the current sample of the series UNEMP with the values 2.4, 3.5, 2.9 and 1.4.
unemp.adjust = 2.4 3.5 2.9 1.4
This command modifies the first ten observations in UNEMP, by replacing them with the values: 3.4, 3.15, 2.9, 3.2, 3.5, 3.7, 3.5, 3.7, 3.5, 3.7. Note that the second observation (3.15) has been interpolated, using linear interpolation, between 3.4 and 2.9. Similarly the 4th observation was interpolated between 2.9 and 3.5. Also note that the values 3.5 and 3.7 were repeated three times.
unemp.adjust = 3.4 . 2.9 . 3.5 3.7 R3(2) ^
The following command replaces the log of the first observation in the current sample with 3.4 (setting the raw value equal to exp(3.4) = 29.96). The second observation is left alone (unless it contains an NA, in which case the log value is interpolated). The third observation’s logged value is replaced with 2.2. The log of the penultimate observation in the current sample is replaced with 3.9, and the last observation with 4.8. All observations between the third and the penultimate are interpolated using a cubic spline interpolation method.
unemp.adjust log = 3.4 # 2.2 .. 3.9 4.8
This command adjusts all the observations in the current sample by adding to the existing values. The first observation has 3.4 added to it. The second has 2.9 added to it, and the third has 4.5 added. The last observation has 1.9 added to it. The values added to the observations in between are calculated via a multiplicative Catmull-Rom spline interpolation.
unemp.adjust += 3.4 2.9 4.5 .. 1.9 &*
Cross-references
See
Appendix B. “Enhanced Spreadsheet Editing” and
“Series Adjust” for additional discussion of series adjustment.
Forecast from a series using an ARIMA model with the specification of the model selected automatically.
Syntax
series.autoarma(options) forecast_name [exogenous_regressors]
Options
tform=arg | Specify the type of dependent variable transformation. arg may be “auto” (automatically decide between log or no transformation, default), “none” (perform no transformation), “log” (perform a log transformation), and “bc” (perform the Box-Cox transformation. |
bc=int | Set the power of the Box-Cox transformation. Only applicable if the tform=bc option is used. |
diff=int | Set the maximum level of differencing to test for. Default value is 2. |
maxar=int | Set the maximum number of AR terms. Default value is 4. |
maxma=int | Set the maximum number of MA terms. Default value is 4. |
maxsar=int | Set the maximum number of seasonal AR terms. Default value is 0. |
maxsma=int | Set the maximum number of seasonal MA terms. Default value is 0. |
periods=int | Set the periodicity of the seasonal ARMA terms. This defaults to the number of observations in a year, based on current workfile frequency. |
avg=key | Use forecast averaging, rather than model selection. key sets the type of averaging to perform, and may take values of “aic” (SAIC weights), “sic” (BMA weights) or “uni” (uniform weights). |
select=key | Set the model selection criteria. key make take values of “aic” (Akaike Information Criteria, default), “sic” (Schwarz Information Criteria), “hq” (Hannan-Quinn criteria) or “mse” (Mean Square Error criteria). This option is ignored if the “avg=” option is used. |
nonconv | Allow non-converged models to be used in model selection or forecast averaging. |
mselen=key | Set the percentage of the estimation sample to be used for MSE calculation. key may take values of “5”, “10”, “15” or “20”. This option is only applicable if the “select=mse” option is used. |
msetype=key | Set the type of forecast to use when calculating MSE. key may either be “dyn” (dynamic, default), or an integer, n, between 1 and 12 indicating that an n-step static forecast should be performed. This option is only applicable if the “select=mse” option is used. |
kpsssig=key | Set the significance level of the KPSS test when determining the appropriate level of differencing for the dependent variable. key may take values of “1”, “5” (default) or “10”. |
fgraph | Output a forecast comparison graph. |
atable | Output a selection criteria comparison table |
agraph | Output a selection criteria comparison graph. |
etable | Output a final equation output table. Not applicable if the “avg=” option is used. |
eqname=name | Create an equation object in the workfile with the same specification as the final selected equation. Not applicable if the “avg=” option is used. |
seed=num | Set the random number generator seed for random starting values. |
prompt | Force the dialog to appear from within a program. |
p | Print results. |
Forecast sample options
The forecast sample will start at the observation immediately after the estimation sample (the current workfile sample). The forecast endpoint is given by either:
forclen=int | Number of periods to forecast. |
forc="date" | Specify the date of the forecast end point. |
If omitted, the end point will be the end of the workfile range.
Example
The commands
wfopen elecdmd.wf1
elecdmd.autoarma(maxsar=1, maxsma=1, noconv, forclen=20, agraph, atable, fgraph) elecdmd_f @expand(@month) realgdp tempf
open the workfile “elecdmd.WF1” and then perform automatic forecasting on the series ELECDMD. The forecasts will be stored in a series called ELECDMD_F. The ARIMAX model includes exogenous regressors of REALGDP, TEMPF and a set of monthly dummy variables, created with the @expand keyword.
The number of maximum SAR terms and SMA terms are set to 1 (instead of the default 0). Model selection is used to determine the best ARMA model, with non-converged models included in the selection process.
The forecast covers 20 periods, and upon completion, EViews will display a graph of the Akaike information criteria of each of the ARMA models considered, as well as a table of each of the selection criteria, and a graph of the each of the forecasts.
Cross-references
See
“Automatic ARIMA Forecasting” for additional discussion.
Perform BDS test for independence.
The BDS test is a Portmanteau test for time-based dependence in a series. The test may be used for testing against a variety of possible deviations from independence, including linear dependence, non-linear dependence, or chaos.
Syntax
series_name.bds(options)
Options
m=arg (default=“p”) | Method for calculating  : “p” (fraction of pairs), “v” (fixed value), “s” (standard deviations), “r” (fraction of range). |
e=number | Value for calculating  . |
d=integer | Maximum dimension. |
b=integer | Number of repetitions for bootstrap p-values. If option is omitted, no bootstrapping is performed. |
o=arg | Name of output vector for final BDS z-statistics. |
prompt | Force the dialog to appear from within a program. |
p | Print output. |
Cross-references
See
“BDS Independence Test” for additional discussion.
Display the boxplots of a series classified into categories.
The
boxplotby command is no longer supported. See
boxplot for the replacement categorical graph command.
Compute and display the band-pass filter of a series.
Computes, and displays a graphical view of the Baxter-King fixed length symmetric, Christiano-Fitzgerald fixed length symmetric, or the Christiano-Fitzgerald full sample asymmetric band-pass filter of the series.
The view will show the original series, the cyclical component, and non-cyclical component in a single graph. For non time-varying filters, a second graph will show the frequency responses.
Syntax
series_name.bpf(options) [cyc_name]
Follow the bpf keyword with any desired options, and the optional name to be given to the cyclical component. If you do not provide cyc_name, the filtered series will be named BPFILTER## where ## is a number chosen to ensure that the name is unique.
To display the graph, you may need to precede the object command with the “show” keyword.
Options
type=arg (default=“bk”) | Specify the type of band-pass filter: “bk” is the Baxter-King fixed length symmetric filter, “cffix” is the Christiano-Fitzgerald fixed length symmetric filter, “cfasym” is the Christiano-Fitzgerald full sample asymmetric filter. |
low=number, high=number | Low (  ) and high (  ) values for the cycle range to be passed through (specified in periods of the workfile frequency). Defaults to the workfile equivalent corresponding to a range of 1.5–8 years for semi-annual to daily workfiles; otherwise sets “low=2”, “high=8”. The arguments must satisfy  . The corresponding frequency range to be passed through will be  . |
lag=integer | Fixed lag length (positive integer). Sets the fixed lead/lag length for fixed length filters (“type=bk” or “type=cffix”). Must be less than half the sample size. Defaults to the workfile equivalent of 3 years for semi-annual to daily workfiles; otherwise sets “lag=3”. |
iorder=[0,1] (default=0) | Specifies the integration order of the series. The default value, “0” implies that the series is assumed to be (covariance) stationary; “1” implies that the series contains a unit root. The integration order is only used in the computation of Christiano-Fitzgerald filter weights (“type=cffix” or “type=cfasym”). When “iorder=1”, the filter weights are constrained to sum to zero. |
detrend=arg (default=“n”) | Detrending method for Christiano-Fitzgerald filters (“type=cffix” or “type=cfasym”). You may select the default argument “n” for no detrending, “c” to demean, or “t” to remove a constant and linear trend. You may use the argument “d” to remove drift, if the option “iorder=1” is also specified. |
nogain | Suppresses plotting of the frequency response (gain) function for fixed length symmetric filters (“type=bk” or “type=cffix”). By default, EViews will plot the gain function. |
noncyc=arg | Specifies a name for a series to contain the non-cyclical series (difference between the actual and the filtered series). If no name is provided, the non-cyclical series will not be saved in the workfile. |
w=arg | Store the filter weights as an object with the specified name. For fixed length symmetric filters (“type=bk” or “type=cffix”), the saved object will be a matrix of dimension  where  is the user-specified lag length order. For these filters, the weights on the leads and the lags are the same, so the returned matrix contains only the one-sided weights. The filtered series  may be computed as: for  . For time-varying filters, the weight matrix is of dimension  where  is the number of non-missing observations in the current sample. Row  of the matrix contains the weighting vector used to generate the  -th observation of the filtered series, where column  contains the weight on the  -th observation of the original series. The filtered series may be computed as: where  is the original series and  is the  element of the weighting matrix. By construction, the first and last rows of the weight matrix will be filled with missing values for the symmetric filter. |
prompt | Force the dialog to appear from within a program. |
p | Print the graph. |
Examples
Suppose we are working in a quarterly workfile and we issue the following command:
lgdp.bpf(type=bk,low=6,high=32) cyc0
EViews will compute the Baxter-King band-pass filter of the series LGDP. The periodicity of cycles extracted ranges from 6 to 32 quarters, and the filtered series will be saved in the workfile in CYC0. The BK filter uses the default lag of 12 (3 years of quarterly data).
Since this is a fixed length filter, EViews will display both a graph of the cyclical/original/non-cyclical series, as well as the frequency response (gain) graph. To suppress the latter graph, we could enter a command containing the “nogain” option:
lgdp.bpf(type=bk,low=6,high=32,lag=12,nogain)
In this example, we have also overridden the default by specifying a fixed lag of 12 (quarters). Since we have omitted the name for the cyclical series, EViews will create a series with a name like BPFILTER01 to hold the results.
To compute the asymmetric Christiano-Fitzgerald filter, we might enter a command of the form:
lgdp.bpf(type=cfasym,low=6,high=32,noncyc=non1,weight=wm) cyc0
The cyclical components are saved in CYC0, the non-cyclical in NON1, and the weighting matrix in WM.
Cross-references
Perform tests on the existence of a bubble in the series.
Calculate either the rolling ADF (RADF), supremum ADF (SADF) or generalized supremum ADF (GSADF) test for the existence of a bubble in an asset.
Syntax
series_name.bubbletest(options)
Options
test=arg | Specify the type of test to perform. Use “SADF” to perform the supremum ADF test, and “GSADF” to perform the generalized supremum ADF test. By default, the rolling ADF test is performed. |
window=int | Set the length of the rolling window (for RADF test), or the initial window length (for SADF and GSADF tests). |
exog=arg | Specification of exogenous trend variables in the test equation: “trend” (include a constant and a linear time trend), “none” (do not include any exogenous regressors). By default, a constant is included. |
lagmethod=arg | Method for selecting lag length (number of first difference terms) to be included in the Dickey-Fuller test regression or number of lags in the AR spectral density estimator: “aic” (Akaike), “sic” (Schwarz), or “hqc” (Hannan-Quinn). |
lag=int | User-specified fixed lag. |
maxlag=int | Maximum lag length to consider when performing automatic lag length selection. |
reps=arg | Number of bootstrap replications. |
seed=int | Set the random number generator seed. |
rng=arg | Set random number generator type. Available types are: improved Knuth generator (“kn”), improved Mersenne Twister (“mt”), Knuth’s (1997) lagged Fibonacci generator used in EViews 4 (“kn4”), L’Ecuyer’s (1999) combined multiple recursive generator (“le”), Matsumoto and Nishimura’s (1998) Mersenne Twister used in EViews 4 (“mt4”). |
nocv | Do not display critical value line in graph. |
cvsig=arg (default=0.95) | Critical value for display in graph and for critical value output series (using “cvout=”). |
out=name | Name of a series to hold the test statistics. |
cvout=name | Name of a series to hold the test critical values. |
prompt | Force the dialog to appear from within a program. |
p | Print results. |
Examples
spy.bubbletest(test=gsadf, window=30, lagmethod=hqc, seed=40)
Performs a generalized supremum bubble test on the SPY series, with an initial window length of 30 observations, using the Hannan-Quinn Criterion to determine the appropriate lag length, and using a seed value of 40 for the random number generator used in the bootstrapped p-values.
Cross-references
Carries out unit root tests which allow for a single breakpoint.
Syntax
series_name.buroot(options)
Basic Specification Options
You should specify the exogenous variables and order of dependent variable differencing in the test equation using the following options:
exog=arg (default=“const”) | Specification of exogenous trend variables in the test equation: “const” “trend” (include a constant and a linear time trend). |
dif=integer (default=0) | Order of differencing of the series prior to running the test. Valid values are {0, 1, 2}. |
Break Options
break=arg (default=“const”) | Specification of breaking trend variables in the test equation: “const” (intercept only), “both” (intercept and trend), “trend” (trend only). The latter two are applicable only if “exog=trend”). |
breakmethod=arg (default=“dfuller”) | Method of specifying the break date: “dfuller” (minimize Dickey-Fuller t-statistic), “minincpt” (minimize intercept break t-statistic), “maxincpt” (maximize intercept break t-statistic), “absincpt” (maximize intercept break absolute t-statistic), “mintrend” (minimize trend break t-statistic), “maxtrend” (maximize trend break t-statistic), “abstrend” (maximize trend break absolute t-statistic), “both” (maximize joint intercept and trend break F-statistic), “user” (fixed break date specified using the “userbreak=” option). |
trim=arg (default=10) | Trimming percentage for allowable break dates to consider in automatic break selection (applicable if the specified break method selects a date on the basis of intercept or trend break coefficients). |
userbreak=dateobs | User-specified break date. |
type=arg (default="io") | Break type: innovation outlier (“io”), additive outlier (“ao”). |
Lag Difference Options
Specifies the number of lag difference terms to be included in the test equation. The default is to perform automatic selection using the Schwarz information criterion. You may specify a fixed lag using the “lag=” option.
lagmethod=arg (default=“sic”) | Method for selecting lag length (number of first difference terms) to be included in the Dickey-Fuller test regressions: “aic” (Akaike), “sic” (Schwarz), “hqc” (Hannan-Quinn), “msaic” (Modified Akaike), “msic” (Modified Schwarz), “mhqc” (Modified Hannan-Quinn), “tstat” (Ng-Perron first backward significant t-statistic), “fstat” (significant F-statistic). |
lag=integer | Use-specified fixed lag. |
maxlag=integer | Maximum lag length to consider when performing automatic lag length selection. default=  |
lagpval=arg (default=0.1) | Probability value for test-based automatic lag selection (when “lagmethod = tstat” and “lagmethod=fstat). |
General options
nograph | Do not display breakpoint selection graph (by default, EViews shows a graph of all of the individual unit root tests and AR coefficients when there is endogenous breakpoint selection). |
output=arg | Output matrix containing individual unit root regression results for all candidate break dates. Each row contains the relevant workfile observation ID (as reported by @TREND), AR coefficient, AR coefficient standard error, number of observations, number of coefficients, number of lags, and if applicable, the t-statistic or F-statistic used in break selection. |
prompt | Force the dialog to appear from within a program. |
p | Print output from the test. |
Cross-references
Empirical distribution functions.
The
cdfplot command is no longer supported. See
distplot.
Test for the presence of cross-sectional dependence in a panel series.
Computes the Breusch-Pagan (1980) LM, Pesaran (2004) scaled LM, Pesaran (2004) CD, and Baltagi, and Feng and Kao (2012) bias-corrected scaled LM test for a panel series.
Syntax
series_name.cdtest
Options
G
Examples
ser1.cdtest
will compute and display the panel cross-section dependence test results.
Cross-references
Perform tests on a change in the location parameter (mean) of the series.
Calculate the standard normal, Quandt-Andrews, Pettitt and Buishand tests for a change in the location of the distribution of a series.
Syntax
series_name.changepoints(options)
Options
G
noboot | Do not calculate bootstrapped p-values. |
simple | Use the simple bootstrap. By default, the sieve bootstrap is used. |
mle | Calculate the bootstrap AR estimates using MLE. Default is to use the HVK estimates. |
reps=arg | Number of bootstrap replications. |
seed=int | Set the random number generator seed. |
rng=arg | Set random number generator type. Available types are: improved Knuth generator (“kn”), improved Mersenne Twister (“mt”), Knuth’s (1997) lagged Fibonacci generator used in EViews 4 (“kn4”), L’Ecuyer’s (1999) combined multiple recursive generator (“le”), Matsumoto and Nishimura’s (1998) Mersenne Twister used in EViews 4 (“mt4”). |
out=name | Specify the name of the matrix containing the test statistics and p-values. |
prompt | Force the dialog to appear from within a program. |
p | Print results. |
Examples
gdpc1.changepoints(iter=19999, out=cpstats)
Performs a change point test on the GDPC1 series, performing 19,999 bootstraps using HVK estimates in a sieve bootstrap, and saving the test statistics and p-values into a matrix object named CPSTATS.
Cross-references
See
“Change Point Tests” for discussion.
Recode the series into classes defined by a grid, specified limits, or quantiles.
Syntax
series_name.classify(options) spec @ outname [mapname]
You should the classify keyword with any desired options, a specification spec, the “@”-sign, the name to be given the output series, and optionally the name for a new valmap object describing the classification.
The form for the spec will depend on which of the four supported methods for classification is employed (using the “method=” option).
• If the default “method=step” is employed, EViews will construct the classification using the set of intervals of size step from start through end. The spec specification is of the form
stepsize start end
where stepsize is a positive numeric value and start and end are numeric values. If start or end are explicitly set to NAs, EViews will use the corresponding minimum and maximum value of the data extended by 5% (e.g., 0.95*min or 1.05*max).
• If “method=bins”, EViews will construct the classification by dividing the range between start and end into a specified number of bins. The specification is of the form:
nbins start end
where nbins in the integer number of bins. Note that depending upon whether you have selected left or right-closed intervals (using the “rightclosed” option), observations with values equal to the start or end may fall out-of-range.
• Using “method=limits” specifies a classification using bins defined by a set of limit values. The spec is given by:
arg1 [arg2 arg3 ...]
where the arguments are limit values or EViews vector objects containing limit values. The first limit value defines the upper limit of the first interval, and the last limit value defines the lower limit of the last interval. Note that there must be at least one limit value and that the values need not be provided in ascending or descending order.
• If “method=quants” is given, EViews uses the specified number of quantiles for the data, specified as an integer value. The specification is:
nquants
where nquants is the integer for the number of quantiles. For deciles you should set nquants =10, for quartiles, nquants = 4.
Options
method=arg (default = “step”) | Method for determining classification values: “step”– create a grid from start through end using the stepsize; “bins” – create bins by dividing the region from start to end into a specified number of bins; “quants” – create bins using the quantile values; “limits” - create bins using the specified limit points. |
rightclosed | Bins formed using right-closed intervals.  is defined to be in the bin from  to  if  . The default is to use intervals closed on the left. |
rangeerr | Generate error if data value is found outside of defined bins. The default is to classify out-of-range values as NAs. |
q=arg (default=“r”) | Quantile calculation method. “b” (Blom), “r” (Rankit-Cleveland), “o” (Ordinary), “t” (Tukey), “v” (van der Waerden), “g” (Gumbel). Only relevant where “method=quants”. |
encode =arg (default=“index”) | Encoding method for output series: “index” – encode as integers from 0 to  where  is the number of bins, where the 0 is reserved for NA encoding if “keepna” is specified; “left” – encode using the left-most value defining the bin; “right” – encode using the right-most value defining the bin; “mid” – encode using the midpoint of the bin. |
keepna | Classify NA values as 0 (for “encode=index” only). |
prompt | Force the dialog to appear from within a program. |
p | Print the results. |
Examples
api5b.classify 100 200 @ api5b_ct api5b_mp
classifies the values of API5B into bins of width 100 starting at 200 and ending at the data maximum times 1.05. The classification results are saved in the series API5B_CT with associated map API5B_MP.
api5b.classify(encode=right) 100 200 1100 @ api5b_ct1
classifies API5B into bins of size 100 from 200 through 1100. The output series API5B_CT1 will contain values taken from the right endpoints of the classification intervals. Observations with out-of-range values will be assigned an NA.
api5b.classify(method=bins, rightclosed, rangeerr) 9 200 1100 @ api5b_ct2 api5b_mp2
defines 9 equally sized bins, starting at 200 and ending at 1100, and classifies the data into bin index identifiers in the series API5B_CT2 with map API5B_MP2. The bins are closed on the right, and out-of-range values will generate an error.
api5b.classify(method=quants, q=g, keepna) 4 @ api5b_ct3
classifies the values of API5B into quartiles (using the Gumbel definition) in the series API5B_CT3. Observations with NA values for API5B will be encoded as 0 in the output series.
Cross-references
See
“Generate by Classification” for additional discussion.
Clear (i.e., replace with NAs) a contiguous block of observations in a series.
Removes the series’s history attribute, as shown in the label view of the series.
Syntax
series_name.clearcontents(start_point) n
where start_point specifies the first of n observations to clear. If n is negative, start_point specifies the last of |n| observations to clear. For dated workfiles, start_point should be entered as a date. For panels and undated workfiles, start_point should be an observation number.
Examples
ser.clearcontents(1952Q2) 10
clears 10 observations starting at 1952 quarter 2.
ser.clearcontents(10) -5
clears 5 observations ending at observation number 10.
Clear the contents of the history attribute for series objects.
Removes the series’s history attribute, as shown in the label view of the series.
Syntax
series_name.clearhist
Examples
s1.clearhist
s1.label
The first line removes the history from the series S1, and the second line displays the label view of S1, including the now blank history field.
Cross-references
See
“Labeling Objects” for a discussion of labels and display names.
Clear the contents of the remarks attribute.
Removes the series’s remarks attribute, as shown in the label view of the series.
Syntax
series_name.clearremarks
Examples
s1.clearremarks
s1.label
The first line removes the remarks from the series S1, and the second line displays the label view of S1, including the now blank remarks field.
Cross-references
See
“Labeling Objects” for a discussion of labels and display names.
Creates a copy of the series.
Creates either a named or unnamed copy of the series.
Syntax
series_name.copy
series_name.copy dest_name
Examples
s1.copy
creates an unnamed copy of the series S1.
s1.copy s2
creates S2, a copy of the series S1.
Cross-references
Display autocorrelation and partial correlations.
Displays the autocorrelation and partial correlation functions of the series, together with the Q-statistics and p-values associated with each lag.
Syntax
series_name.correl(n, options)
You must specify the largest lag n to use when computing the autocorrelations.
Options
d=integer (default=0) | Compute correlogram for specified difference of the data. |
prompt | Force the dialog to appear from within a program. |
p | Print the correlograms. |
Examples
ser1.correl(24)
Displays the correlograms of the SER1 series for up to 24 lags.
Cross-references
See
“Autocorrelations (AC)” and
“Partial Autocorrelations (PAC)” for a discussion of autocorrelation and partial correlation functions, respectively.
Display table, graph, or spool output in the series object window.
Display the contents of a table, graph, or spool in the window of the series object.
Syntax
series_name.display object_name
Examples
series1.display tab1
Display the contents of the table TAB1 in the window of the object SERIES1.
Cross-references
Most often used in constructing an EViews Add-in. See
“Custom Object Output”.
Display name for series objects.
Attaches a display name to a series object which may be used to label output in tables and graphs in place of the standard series object name.
Syntax
series_name.displayname display_name
Display names are case-sensitive, and may contain a variety of characters, such as spaces, that are not allowed in series object names.
Examples
hrs.displayname Hours Worked
hrs.label
The first line attaches a display name “Hours Worked” to the series HRS, and the second line displays the label view of HRS, including its display name.
gdp.displayname US Gross Domestic Product
plot gdp
The first line attaches a display name “US Gross Domestic Product” to the series GDP. The line graph view of GDP from the second line will use the display name as the legend.
Cross-references
See
“Labeling Objects” for a discussion of labels and display names.
Save a matrix containing distribution plot data computed from the series.
Saves the data used to display a histogram, kernel density, theoretical distribution, empirical CDF or survivor plot, or quantile plot to the workfile.
Syntax
series_name.distdata(dtype=dist_type, dist_options) matrix_name
saves the distribution plot data specified by dist_type, where dist_type must be one of the following keywords:
hist | Histogram (default). |
freqpoly | Histogram Polygon. |
edgefreqpoly | Histogram Edge Polygon. |
ash | Average Shifted Histogram. |
kernel | Kernel density |
theory | Theoretical distribution. |
cdf | Empirical cumulative distribution function. |
survivor | Empirical survivor function. |
logsurvivor | Empirical log survivor function. |
quantile | Empirical quantile function. |
theoryqq | Theoretical quantile-quantile plot. |
Options
The theoretical quantile-quantile plot type “theoryqq” takes the options described in
qqplot under
“Theoretical Options”.
For the remaining types,
dist_options are any of the distribution type-specific options described in
distplot.
Note that the graph display specific options such as “fill,” “nofill,” and “leg,” and “noline” are not relevant for this procedure.
You may use the “prompt” option to force the dialog display
prompt | Force the dialog to appear from within a program. |
Examples
gdp.distdata(dtype=hist, anchor=0, scale=dens, rightclosed) matrix01
creates the data used to draw a histogram from the series GDP with the anchor at 0, density scaling, and right-closed intervals, and stores that data in a matrix called MATRIX01 in the workfile.
unemp.distdata(dtype=kernel, k=b,ngrid=50,b=.5) matrix02
generates the kernel density data computed with a biweight kernel at 50 grid points, using a bandwidth of 0.5 and linear binning, and stores that data in MATRIX02.
wage.distdata(dtype=theoryqq, q=o, dist=logit, p1=.5) matrix03
creates theoretical quantile-quantile data from the series WAGE using the ordinary quantile method to calculate quantiles. The theoretical distribution is the logit distribution, with the location parameter set to 0.5. The data is saved into the matrix MATRIX03.
Cross-references
For a description of distribution graphs and quantile-quantile graphs, see
“Analytical Graph Types”.
See also
distplot and
qqplot.
Seasonally adjust daily series using the DSA method.
Syntax
series_name.dsa(options) seas_name [@fa factor_name] [@trnd trend_name]
You may follow the dsa keyword with a name to save the seasonally adjusted series. Further, you may use the @fa and @trnd keywords to provide names for the saved seasonal factors and the trend series.
Options
forc=arg | Specify the end date of the forecast. If not specified, the last observation in the workfile is used. The forecast begins at the observation following the current workfile sample (note, if the workfile sample is equal to the workfile range, no forecasting is performed). |
extendfri | For 5-day week data, interpolate to 7-day weeks by repeating the Friday value for Saturday and Sunday. Default is to perform 5-day DSA instead of converting to 7-day. |
interwkend | For 5-day week data, interpolate to 7-day weeks by using linear interpolation between the Friday value and Monday values for Saturday and Sunday. Default is to perform 5-day DSA instead of converting to 7-day. |
fixedarima | Use a fixed ARIMA model. Default is to use model selection to determine the ARIMA model. |
nodiff | Set the level of differencing in the ARIMA model to 0. Default is 1 if using a fixed ARIMA model, or a choice between 0 and 1 if using automatic selection. |
maxar=integer | If using fixed ARIMA model (see the fixedarima option), specify the AR order. If using automatic selection, specify the maximum AR order. |
maxma=integer | If using fixed ARIMA model (see the fixedarima option), specify the MA order. If using automatic selection, specify the maximum MA order. |
fixedtrig | Use a fixed number of trigonometric terms to model the seasonal patters in the ARIMA model. Default is to use model selection to determine the number of terms. |
maxtrig=integer | If using fixed number of trigonometric terms (see the fixedtrig option), specify the number of terms. If using automatic selection, specify the maximum number of terms. |
olnoao | Do not perform detection of AO outliers. Default is to detect AO outliers. |
olnoio | Do not perform detection of IO outliers. Default is to detect AO outliers. |
olls | Include detection of LS outliers. Default is to not detect LS outliers. |
oltc | Include detection of TC outliers. Default is to not detect TC outliers. |
olcvalue=arg | Specify the critical value for the outlier detection process. |
oldelta=arg | Specify the delta value for the TC outlier detection process. |
olinits=integer | Specify number of inner iterations in the outlier detection process. |
oloutits=integer | Specify number of outer iterations in the outlier detection process. |
extenddow | When forecasting day-of-week factors, repeat the last week of actual data throughout the forecast period. Default is to use exponential smoothing to forecast the factors. |
prompt | Force the dialog to appear from within a program. |
p | Print view. |
STL options
Day-of-week
weeksp=integer | Specify the seasonal polynomial degree. Default is 0. |
weektp=integer | Specify the trend polynomial degree. Default is 1. |
weekfp=integer | Specify the filter polynomial degree. Default is 1. |
weeksl=integer | Specify the length of the seasonal smoothing window (odd integers only). Default is 151. |
weektl=integer | Specify the length of the trend smoothing window (odd integers only). Default is based upon the seasonal smoothing window length. |
weekfl=integer | Specify the length of the filter smoothing window (odd integers only). Default is 1. |
weekinits=integer | Specify number of inner iterations. Default is 1. |
weekoutits=integer | Specify the number of outer iterations. Default is 15. |
Day-of-month
monthsp=integer | Specify the seasonal polynomial degree. Default is 0. |
monthtp=integer | Specify the trend polynomial degree. Default is 1. |
monthfp=integer | Specify the filter polynomial degree. Default is 1. |
monthsl=integer | Specify the length of the seasonal smoothing window (odd integers only). Default is 51. |
monthtl=integer | Specify the length of the trend smoothing window (odd integers only). Default is based upon the seasonal smoothing window length. |
monthfl=integer | Specify the length of the filter smoothing window (odd integers only). Default is 1. |
monthinits=integer | Specify number of inner iterations. Default is 1. |
monthoutits=integer | Specify the number of outer iterations. Default is 15. |
Day-of-year
yearsp=integer | Specify the seasonal polynomial degree. Default is 0. |
yeartp=integer | Specify the trend polynomial degree. Default is 1. |
yearfp=integer | Specify the filter polynomial degree. Default is 1. |
yearsl=integer | Specify the length of the seasonal smoothing window (odd integers only). Default is 13. |
yeartl=integer | Specify the length of the trend smoothing window (odd integers only). Default is based upon the seasonal smoothing window length. |
yearfl=integer | Specify the length of the filter smoothing window (odd integers only). Default is 1. |
yearinits=integer | Specify number of inner iterations. Default is 1. |
yearoutits=integer | Specify the number of outer iterations. Default is 15. |
Example
elecdmd.dsa(forc="2015/6/30") elecdmd_adjusted
Performs daily seasonal adjustment on the ELECDMD series, specifying that the forecast end point should be 30 June 2015, and that the final adjusted series should be named ELECDMD_ADJUSTED.
elecdmd.dsa(fixedtrig, nodom, nodoy) elecdmd_adjusted @fa elecdmd_factors
Performs daily seasonal adjustment on ELECDMD, using a fixed number of trigonometric terms in the ARIMA step, and without using day-of-month or day-of-year STL. As well as saving the final adjusted series as ELECDMD_ADJUSTED, the final seasonal factor are also saved under ELECDMD_FACTORS.
Cross-references
Duplicate observations display for observations in the series.
Syntax
series_name.dups(opts)
By default, EViews displays a summary table showing the number of duplicate groups of a given size, but you may use the options to display an alternative view.
Of particular note is that the spreadsheet and individual duplicates displays are interactive - clicking on rows in one will open the display to show the other. Thus, clicking on a duplicate in the spreadsheet view will jump to show all of the observations that share that duplicate. Similarly, clicking on an observation in the shared individual duplicates view will jump to the corresponding observation in the full spreadsheet.
Options
graph | Display observation graph showing duplicates. |
sheet | Display spreadsheet view of duplicates. |
individ | Display first individual duplicates. |
Examples
ser1.dups
displays the duplicates summary for the series SER1.
ser1.dups(sheet)
displays a spreadsheet showing highlighted duplicates.
Cross-references
For a description of the duplicates view, see
“Duplicates Analysis”.
Computes goodness-of-fit tests based on the empirical distribution function.
Compute Kolmogorov-Smirnov, Lilliefors, Cramer-von Mises, Anderson-Darling, and Watson empirical distribution function tests using the current sample.
Syntax
series_name.edftest(options)
Options
General Options
dist=arg (default=”nomal”) | Distribution to test: “normal” (Normal distribution), “chisq” (Chi-square distribution), “exp” (Exponential distribution), “xmax” (Extreme Value - Type I maximum), “xmin” (Extreme Value Type I minimum), “gamma” (Gamma), “logit” (Logistic), “pareto” (Pareto), “uniform” (Uniform). |
p1=number | Specify the value of the first parameter of the distribution (as it appears in the dialog). If this option is not specified, the first parameter will be estimated. |
p2=number | Specify the value of the second parameter of the distribution (as it appears in the dialog). If this option is not specified, the second parameter will be estimated. |
p3=number | Specify the value of the third parameter of the distribution (as it appears in the dialog). If this option is not specified, the third parameter will be estimated. |
prompt | Force the dialog to appear from within a program. |
p | Print test results. |
Estimation Options
The following options apply if iterative estimation of parameters is required:
b | Use Berndt-Hall-Hall-Hausman (BHHH) algorithm. The default is Marquardt. |
m=integer | Maximum number of iterations. |
c=number | Set convergence criterion. The criterion is based upon the maximum of the percentage changes in the scaled coefficients. |
showopts / ‑showopts | [Do / do not] display the starting coefficient values and estimation options in the estimation output. |
s | Take starting values from the C coefficient vector. By default, EViews uses distribution specific starting values that typically are based on the method of the moments. |
Examples
The command
x.edftest
uses the default settings to test whether data in the series x for the current sample comes from a normal distribution. Both the location and scale parameters are estimated from the data in X.
x.edftest(type=chisq)
tests whether the data in X follow a

distribution with degrees-of-freedom estimated from the data.
freeze(tab1) x.edftest(type=chisq, p1=5)
tests whether the series x comes from a

distribution with 5 degrees of freedom. The output is stored as a table object
TAB1.
Cross-references
See
“Empirical Distribution Tests” for a description of the goodness-of-fit tests.
Perform Error-Trend-Season (ETS) exponential smoothing.
The ets procedure forecasts a series using the ETS model framework with state-space based likelihood calculations, support for model selection, and calculation of forecast standard errors.
The ETS framework defines an extended class of exponential smoothing models, including the standard exponential smoothing models (e.g., Holt and Holt-Winters additive and multiplicative models).
Syntax
series_name.ets(options) smooth_name
You should enter the ets keyword followed by options and then the a name for the smoothed output series. You can specify the smoothing method (the default setting is additive error, no trend, no seasonality) and the smoothing options in the parenthesis.
Options
Forecast sample options
The forecast sample will start at the observation immediately after the estimation sample (the current workfile sample). The forecast endpoint is given by either:
forclen=int | Number of periods to forecast. |
forc="date" | Specify the date of the forecast end point. |
One of these options is required.
General
prompt | Force the dialog to appear from within a program. |
p | Print the view. |
Model specification
e=arg (default = “a”) | Set error type: “a” (additive), “m” (multiplicative), “e” (auto). |
t=arg (default = “n”) | Set trend type. key can be: “n” (none), “a” (additive), “m” (multiplicative), “ad” (additive dampened), “md” (multiplicative dampened), “e” (auto). |
s=arg (default = “n”) | Set season type. key can be: “n” (none), “a”(additive), “m” (multiplicative), “e” (auto). |
modsel=arg (default= “aic”) | Model selection method: “aic” (Akaike information criterion), “bic” (Bayesian information criterion/Schwartz criterion), “hq” (Hannan-Quinn information criterion), “amse” (average mean squared errors). |
alpha=arg | Specify fixed value for level parameter  . |
beta=arg | Specify fixed value for trend parameter  in models with trend. |
gamma=arg | Specify fixed value for seasonal parameter  in models with a seasonal component. |
phi=arg | Specify fixed value for dampening parameter  in models with dampened trends. |
nomult | Do not allow multiplicative trend or seasonal terms. Only applies if the t=e or s=e options are set. |
Optimization options
amse | Set Average Mean Square Error (AMSE) as the objective function (The default is log-likelihood as the objective function). |
namse=integer | Specify the AMSE length—the number of observations over which to calculate AMSE if “amse” is selected. |
c=number | Set the convergence criteria. |
m=integer | Set the maximum number of iterations. |
ustart | Employ user-supplied starting values (taken from the C vector in the workfile). |
noi | Do not optimize the initial state values (fix at their starting values). |
Output options
dgraph=arg | Include a decomposition graph for each specified element. arg may be composed of any of the following elements: “f” (forecast), “l” (level), “t” (trend), “s” (season). |
dgopt=arg (default =“m”) | Format for display of decomposition graph: “m” (multiple graph), “s” (single graph) |
graph=arg | Include a comparison graph in the output for each specified element (if model selection is employed). arg may be composed of any of the following elements: “c” (forecast comparison) and “l” (likelihood comparison). |
table=arg | Include a comparison table in the output (if model selection is employed). arg may be composed of any of the following elements: “c” (forecast comparison) and “l” (likelihood comparison). |
level=name | Save the level component as a separate series in the workfile. |
trend=name | Save the trend component as a separate series in the workfile (if applicable). |
season=name | Save the seasonal component as a separate series in the workfile (if applicable). |
Examples
sales.ets(e=a, t=n, s=a)sales_f
smooths the series SALES using the an ANN (additive error, no trend, no seasonal) model and creates the smoothed series named “SALES_F”.
tb3.ets(e=e, t=e, s=n) tb3_smooth
will smooth TB3, automatically selecting the best smoothing model amongst the different Error and Trend specifications (the Seasonal specification is set at none).
sales.ets(e=a, t=a, s=a, dgopt=m, dgraph=flts)
will smooth the series SALES using the an AAA (additive error, additive trend, additive seasonal) model and display the output in a spool object which contains the actual and decomposition series (i.e., forecast, trend, level, and seasonal series) in multiple graphs.
sales.ets(e=a, t=a, s=a, level=level1, trend=trend1, season=season1, dgopt=s, dgraph=flts)
will smooth the series SALES using the an AAA (additive error, additive trend, additive seasonal) model, create the decomposition series named level, trend, and season series as level1, trend1, and season1, respectively, and display a spool object which contains the actual and decomposition graphs in a single graph.
tb3.ets(e=e, t=e, s=e, graph=cl)
will find out the best model amongst the different Error, Trend, and Seasonal specifications and present the estimation results in a spool object which contains the graphs with forecast and likelihood comparison graphs between all available models.
tb3.ets(e=a, t=e, s=e, amse, table=cl)
will search for the best model using average mean square errors calculations and display the estimation results in a spool object with forecast and likelihood comparison tables.
Cross-references
See
“Exponential Smoothing” for a discussion of exponential smoothing methods.
Fill a series object with specified values.
Syntax
series_name.fill(options) n1[, n2, n3 …]
Follow the keyword with a list of values to place in the specified object. Each value should be separated by a comma. By default, series fill ignores the current sample and fills the series from the beginning of the workfile range. You may provide sample information using options.
Running out of values before the object is completely filled is not an error; the remaining cells or observations will be unaffected, unless the “l” option is specified. If, however, you list more values than the object can hold, EViews will not modify any observations and will return an error message.
Options
l | Loop repeatedly over the list of values as many times as it takes to fill the series. |
o=[date, integer] | Set starting date or observation from which to start filling the series. Default is the beginning of the workfile range. |
s | Fill the series only for the current workfile sample. The “s” option overrides the “o” option. |
s=sample_name | Fill the series only for the specified subsample. The “s” option overrides the “o” option. |
Examples
To generate a series D70 that takes the value 1, 2, and 3 for all observations from 1970:1:
series d70=0
d70.fill(o=1970:1,l) 1,2,3
Note that the last argument in the fill command above is the letter “l”. The next three lines generate a dummy series D70S that takes the value one and two for observations from 1970:1 to 1979:4:
series d70s=0
smpl 1970:1 1979:4
d70s.fill(s,l) 1,2
smpl @all
Assuming a quarterly workfile, the following generates a dummy variable for observations in either the third and fourth quarter:
series d34
d34.fill(l) 0, 0, 1, 1
Note that this series could more easily be generated using
@seas or the special workfile functions (see
“Basic Date Functions”).
Average different forecasts of a series.
Syntax
series.forcavg(options) forecast_data
You should specify the forecast data to be averaged by entering a list of objects as forecast_data. The list may be a list of series objects, a group object, a series naming pattern (such as “f*” to indicate all series starting with the letter “F”), or a list of equation objects.
If a list of equations is entered, EViews will automatically forecast from those equation objects over the forecast sample (the current workfile sample).
Options
wgt=”key” | Set the type of averaging to use. key can be “mean” (default), “trmean” (trimmed-mean), “med” (median), “ols” (least squares weights), “mse” (mean square error weights), “ranks”, (MSE ranks), “aic” (Smoothed AIC weights), or “sic” (BMA weights). “aic” and “sic” are only available if a list of equations is provided as the forecast_data. |
trim=num | Set the level of trimming for the Trimmed mean method. Num should be a number between 1 and 100. Only applicable if the “trmean” option is used. |
msepwr=int | Set the power to which the MSE values are raised in the MSE ranks method. Only applicable if the “mseranks” option is used. |
s | Use a static (rather than dynamic) forecast when computing the forecasts over the training sample. Only applicable if forecast_data is a list of equation objects. |
forcsmpl=arg | Forecast sample (optional). If forecast sample is not provided, the workfile sample will be employed. |
trainsmpl=arg | Specify the sample used for calculating the averaging weights. Only applicable if the “ols”, “mse”, “mseranks”, “aic” or “sic” options are used. |
name=arg | Set the name of the final averaged series. |
wgtname=arg | Save the weights into a vector in the workfile with the name wgtname. |
Example
The commands
wfopen elecdmd.wf1
elecdmd.forcavg(trainsmpl="2012M1 2012M12", wgt=mse) elecf_fe*
open the workfile elecdmd.wf1 and then perform forecast averaging using the actual series ELECDMD, and the forecast series specified by the naming pattern ELECF_FE*.
The averaging method MSE is used. A training sample of 2012M1 to 2012M12 is used to calculate the weights in the MSE and MSE Ranks methods.
Cross-references
See
“Forecast Averaging” for additional discussion.
Evaluate different forecasts of a series, and perform the forecast combination test.
Syntax
series.forceval(options) forecast_data
You should specify the forecast data to be evaluated by entering a list of objects as forecast_data. The list may be a list of series objects, a group object, a series naming pattern (such as “f*” to indicate all series starting with the letter “F”), or a list of equation objects.
If a list of equations is entered, EViews will automatically forecast from those equation objects over the evaluation sample (the current workfile sample).
Options
mean | Include the Mean averaging method. |
trmean | Include the Trimmed mean averaging method. |
median | Include the Median averaging method. |
ols | Include the Least-squares averaging method. |
mse | Include the Mean Square Error averaging method. |
mseranks | Include the MSE ranks averaging method. |
aic | Include the Smoothed AIC weights averaging method. Only applicable if forecast_data is a list of equation objects. |
sic | Include the Bayesian model averaging method. Only applicable if forecast_data is a list of equation objects. |
trim=num | Set the level of trimming for the Trimmed mean method. Num should be a number between 1 and 100. Only applicable if the “trmean” option is used. |
msepwr=int | Set the power to which the MSE values are raised in the MSE ranks method. Only applicable if the “mseranks” option is used. |
s | Use a static (rather than dynamic) forecast when computing the forecasts over the training sample. Only applicable if forecast_data is a list of equation objects. |
trainsmpl=arg | Specify the sample used for calculating the averaging weights. Only applicable if the “ols”, “mse”, “mseranks”, “aic” or “sic” options are used. |
testname=arg | Save the combination test statistics into a matrix named arg. |
statname=arg | Save the names of the best performing forecasts into an svector named arg. |
Example
The commands
wfopen elecdmd.wf1
elecdmd.forcval(trainsmpl="2012M1 2012M12", mean, mse, mseranks, msepwr=2) elecf_fe*
open the workfile elecdmd.wf1 and then perform forecast evaluation using the actual series ELECDMD, and the forecast series specified by the naming pattern ELECF_FE*.
The averaging methods Mean, MSE and MSE Ranks are used, with the power of the MSE Ranks method set at “2”. A training sample of 2012M1 to 2012M12 is used to calculate the weights in the MSE and MSE Ranks methods.
Cross-references
See
“Label” for additional discussion.
Compute frequency tables.
The freq command performs a one-way frequency tabulation.
Frequencies are computed for the current sample of observations. Observations with NAs are dropped unless included by option. You may use options to control automatic binning (grouping) of values and the order of the entries of the table.
Syntax
series_name.freq(options)
Options
dropna (default) / keepna | [Drop/Keep] NA as a category. |
v=integer (default=1000) | Make bins if the number of distinct values or categories exceeds the specified number. |
nov | Do not make bins on the basis of number of distinct values; ignored if you set “v=integer.” |
a=number | (optional) Make bins if average count per distinct value is less than the specified number. |
b=integer (default=50) | Maximum number of categories to bin into if performing automatic binning. |
n, obs, count (default) | Display frequency counts. |
nocount | Do not display frequency counts. |
total (default) / nototal | [Display / Do not display] totals. |
pct (default) / nopct | [Display / Do not display] percent frequencies. |
cum (default) / nocum | (Display/Do not) display cumulative frequency counts/percentages. |
sort=arg (default=“lohi”) | Sort order for entries in the frequency table: high data value to low ("hilo"), low data value to high ("lohi" –default), high frequency to low ("freqhilo"), low frequency to high ("freqlohi"). |
prompt | Force the dialog to appear from within a program. |
p | Print the table. |
Examples
hrs.freq(nov, noa)
tabulates each value (no binning) of HRS, with entries in ascending value order. The table will display counts, percentages, and cumulative frequencies.
inc.freq(v=200, b=50, keepna, noa)
tabulates INC including NAs. The observations will be binned if INC has more than 200 distinct values; EViews will create at most 50 equal value-width bins. The number of bins may be smaller than 50.
inc.freq(sort=freqhilo)
tabulates INC with the table rows ordered from values with highest frequency to lowest.
Cross-references
See
“One-Way Tabulation” for a discussion of frequency tables.
Declare a series object with a formula for auto-updating, or specify a formula for an existing series.
Syntax
frml series_name = series_expression
frml series_name = @clear
Follow the frml keyword with a name for the series, and an assignment statement. The special keyword “@CLEAR” is used to return the auto-updating series to an ordinary numeric series.
Examples
To define an auto-updating numeric series, you must use the frml keyword prior to entering an assignment statement. The following example creates a series named LOW that uses a formula to compute its values.:
frml low = inc<=5000 or edu<13
The auto-updating series takes the value 1 if either INC is less than or equal to 5000 or EDU is less than 13, and 0 otherwise, and will be re-evaluated whenever INC or EDU change.
You may apply a frml to an existing series. The commands:
series z = 3
frml z =(x+y)/2
makes the previously created series Z an auto-updating series containing the average of series X and Y. Note that once a series is defined to be auto-updating, it may not be modified directly. Here, you may not edit Z, nor may you generate values into the series.
Note that the commands:
series z = 3
z = (x+y)/2
while similar, produce quite different results, since the absence of the frml keyword in the second example means that EViews will generate fixed values in the series instead of defining a formula to compute the series values. In this latter case, the values in the series Z are fixed, and may be modified.
One particularly useful feature of auto-updating series is the ability to reference series in databases. The command:
frml gdp = usdata::gdp
creates a series called GDP that obtains its values from the series GDP in the database USDATA. Similarly:
frml lgdp = log(usdata::gdp)
creates an auto-updating series that is the log of the values of GDP in the database USDATA.
To turn off auto-updating for a series, you should use the special expression “@CLEAR” in your frml assignment. The command:
frml z = @clear
sets the series to numeric value format, freezing the contents of the series at the current values.
Cross-references
Generate series.
Syntax
genr ser_name = expression
Examples
genr y = 3 + x
generates a numeric series that takes the values from the series X and adds 3.
Cross-references
See
Series::series for a discussion of the expressions allowed in
genr.
Histogram and descriptive statistics of a series.
The hist command displays descriptive statistics and a histogram for the data in the series.
Syntax
series_name.hist(options)
Options
Examples
lwage.hist
Displays the histogram and descriptive statistics of LWAGE.
Cross-references
See
“Histogram and Stats” for a discussion of the descriptive statistics reported in the histogram view.
See
distplot for a more fully-featured and customizable method of constructing histograms and
Series::stats stats for a view with a more extensive set of basic descriptive statistics.
Smooth a series using the Hodrick-Prescott filter.
Syntax
series_name.hpf(options) filtered_name [@ cycle_name]
You may need to prepend the “show” keyword to display the graph the smoothed and original series.
Smoothing Options
The degree of smoothing may be specified as an option. You may specify the smoothing as a value, or using a power rule:
lambda=arg | Set smoothing parameter value to arg; a larger number results in greater smoothing. |
power=arg (default=2) | Set smoothing parameter value using the frequency power rule of Ravn and Uhlig (2002) (the number of periods per year divided by 4, raised to the power arg, and multiplied by 1600). Hodrick and Prescott recommend the value 2; Ravn and Uhlig recommend the value 4. |
m=arg (default=1) | Set number of iterations. |
ic | Use information criteria to determine the optimal number of iterations. |
prompt | Force the dialog to appear from within a program. |
If no smoothing option is specified, EViews will use the power rule with a value of 2.
Other Options
p | Print the graph of the smoothed series and the original series. |
Examples
gdp.hpf(lambda=1000) gdp_hpmodsel
smooths the GDP series with a smoothing parameter “1000” and saves the smoothed series as GDP_HP.
gdp.hpf(power=4) gdp_hp @ gdp_cycle
smooths the same series with a power parameter of “4” and saves the smoothed series as GDP_HP, and the cycle series as GDP_CYCLE.
Cross-references
Shift the observations of the series up or downwards, inserting blank observations.
Syntax
series_name.insertobs(startpoint) n
Where startpoint specifies the first or last observation from which the observations are shifted. For dated workfiles, startpoint should be entered as a date. For panels and non-dated workfiles startpoint should be an observation number.
n specifies the number of observations shifted.
Examples
x.insertobs(1952q2) 2
Inserts 2 new observations beginning at observation 1952 quarter 2. The previous value associated with 1952Q2 will now correspond to 1952Q4.
y.insertobs(10) -5
Inserts 5 new observations ending at observation number 10 in the workfile.
Fill in missing values, or NAs, within a series by interpolating from values that are not missing.
Syntax
series_name.ipolate(options) series_name
Options
type = key | Specify the interpolation method. key is either “lin” (linear, default), “log” (log-linear), “cs” (Cardinal spline), “cr” (Catmull-Rom spline), “cb” (Cubic spline), “lcs” (log-cardinal spline), “lcr” (log-Catmull-Rom spline), or “lcb” (log-cubic spline). |
tension = number | Sets the tension parameter for the Cardinal spline method of interpolation. number should be a number between 0 and 1. |
f = arg (default = “actual”) | Out-of-sample fill behavior: “actual” (fill observations outside the interpolated sample with values from the source series). “na” (fill observations outside the sample with missing values” |
prompt | Force the dialog to appear from within a program. |
Examples
The following lines interpolate the missing values of series X1 using linear interpolation, and store the new interpolated series with a name X_INTER:
x1.ipolate x_inter
This line performs the same interpolation, but this time using the Cardinal spline, with a tension value of 0.8:
x1.ipolate(type=cs, tension=0.8) x_inter
Cross-references
See
“Interpolate” for discussion.
Executes the JDemetra+ seasonal adjustment routine on the series.
JDemetra+ is available only for quarterly and monthly series, and only performs X-13 style seasonal adjustment.
Syntax
series_name.jdemetra(options)
Options
spec=arg | Set the JDemetra+ default specification. arg can be "X11", "RSA0", "RSA1", "RSA2c", "RSA3", "RSA4c", "RSA5c". The default is "RSA4c". |
d9 | Export the SI replacement values d9 series to the workfile. |
d10 | Export the seasonal factors d10 series to the workfile. |
nod11 | Do not export the seasonal adjustment d11 series to the workfile. |
d12 | Export the trend d12 series to the workfile. |
d13 | Export the irregular component d13 series to the workfile. |
d16 | Export the combined adjustment factors d16 series to the workfile. |
x11mode=arg | Set the X-11 decomposition mode. arg can be “Auto” (JDemetra+ automatically selected the decomposition mode, default), “Add” (Additive), “Mult” (Multiplicative), “log” (Log-additive), “Pseudo” (Pseudo-additive). |
suffix=arg | Suffix to add to the exported series names before the series type. For example, if the underlying series is named GDP, and a suffix of "_JDSA" is provided, the exported d11 series will be named GDP_JDSA_D11. By default, no additional suffix is provided, so the d11 series would be named GDP_D11. |
tform=arg | Set the dependent variable transformation in the pre-adjustment regression. arg can be "none", "auto", "log". If omitted, JDemetra+ will use the transformation setting of the default specification. |
noarma | Do not perform ARIMA estimation during the pre-adjustment regression of the seasonal adjustment. If one of the noarma, autoarma and fixedarma options are not provided, JDemetra+ will use the ARIMA estimation type of the default specification. |
autoarma | Perform automatic ARIMA order selection during the pre-adjustment regression of the seasonal adjustment. If one of the noarma, autoarma and fixedarma options are not provided, JDemetra+ will use the ARIMA estimation type of the default specification. |
fixedarma | Perform ARIMA estimation during the pre-adjustment regression of the seasonal adjustment. If one of the noarma, autoarma and fixedarma options are not provided, JDemetra+ will use the ARIMA estimation type of the default specification. |
ar=int | If using fixedarma, specify the AR order. If omitted, JDemetra+ will use its default ARIMA model order. |
ma=int | If using fixedarma, specify the MA order. If omitted, JDemetra+ will use its default ARIMA model order. |
d=int | If using fixedarma, specify the ARIMA differencing. If omitted, JDemetra+ will use its default ARIMA model order. |
sar=int | If using fixedarma, specify the seasonal AR order. If omitted, JDemetra+ will use its default ARIMA model order. |
sma=int | If using fixedarma, specify the seasonal MA order. If omitted, JDemetra+ will use its default ARIMA model order. |
sd=int | If using fixedarma, specify the ARIMA seasonal differencing. If omitted, JDemetra+ will use its default ARIMA model order. |
outliers | Include automatic outlier detection in the pre-adjustment regression regression. If omitted, JDemetra+ will use the outlier detection setting of the default specification. |
nooutliers | Do not include automatic outlier detection in the pre-adjustment regression. If omitted, JDemetra+ will use the outlier detection setting of the default specification. |
tradedays=arg | Specify the type of trading day adjustment made in the pre-adjustment regression. arg can be "none", "td2c", "td2", "td3", "td3c", "td4", "td7". If omitted, JDemetra+ will use the trading day type set by the default specification. |
leapyr | Use the leap year adjustment in the pre-adjustment regression. If both leapyr and noleapyr are omitted, JDemetra+ will use the option set by the default specification. |
noleapyr | Do not use the leap year adjustment in the pre-adjustment regression. If both leapyr and noleapyr are omitted, JDemetra+ will use the option set by the default specification. |
fcast | Forecast from the pre-adjustment regression model. If fcast and nofcast are omitted, JDemetra+ will use the setting of the default specification. |
nofcast | Do not forecast from the pre-adjustment regression model. If fcast and nofcast are omitted, JDemetra+ will use the setting of the default specification. |
flen=int | If forecasting the pre-adjustment regression model, set the number of observations to be forecast. If omitted, a year of observations will be forecasted. |
userregs=“arg” | Provide a list of user-variables used in the pre-adjustment regression model. arg should be a space delimited list of series objects or series generation expressions, surrounded in quotes. |
usertypes=“arg” | Specify the variable types for the user-variables provided with a userregs= option. arg should be a space delimited list of keywords, with one keyword per user-variable, in the same order as given in the userregs option. Keyword values can be; "undef" (undefined), "ser" (series), "trnd" (trend), "seas" (seasonal), "sa" seasonally adjusted, "irreg" (irregular), or "cal" (calendar). If omitted, user-variables are set to undefined. |
tdtest=arg | Specifies whether to test for the inclusion of Trading Day effects. "Remove" (default) tests for the removal of effects. "Add" tests for the inclusion of effects. "None" performs no testing (effects are always included). |
eastertest=arg | Specifies whether to test for the inclusion of Easter effects. "Remove" (default) tests for the removal of effects. "Add" tests for the inclusion of effects. "None" performs no testing (effects are always included). |
Examples
hstartsnsa.jdemetra(d10, suffix=_jdm, spec=rsa5c, nooutliers)
This will execute the JDemetra+ X-13 based seasonal adjustment routine on the series HSTARTSNSA. The JDemetra+ RSA5c default specification is used, but outlier detection is turned off. The seasonal factors and seasonally adjusted data are stored into the workfile with the names HSTARTSNA_JDM_D10 and HSTARTSNA_JDM_D11 respectively.
Cross-references
See
“JDemetra+” for discussion.
Kernel density plots.
The
kdensity command is no longer supported. See
distplot.Display or change the label view of a series object, including the last modified date and display name (if any).
As a procedure, label changes the fields in the series label.
Syntax
series_name.label
series_name.label(options) [text]
Options
The first version of the command displays the label view of the series. The second version may be used to modify the label. Specify one of the following options along with optional text. If there is no text provided, the specified field will be cleared.
c | Clears all text fields in the label. |
d | Sets the description field to text. |
s | Sets the source field to text. |
u | Sets the units field to text. |
r | Appends text to the remarks field as an additional line. |
p | Print the label view. |
Examples
The following lines replace the remarks field of SER1 with “Data from CPS 1988 March File”:
ser1.label(r)
ser1.label(r) Data from CPS 1988 March File
To append additional remarks to SER1, and then to print the label view:
ser1.label(r) Log of hourly wage
ser1.label(p)
To clear and then set the units field, use:
ser1.label(u) Millions of bushels
Cross-references
See
“Labeling Objects” for a discussion of labels.
Compute the symmetric, one-sided, or strict one-sided long-run variance of a series.
Syntax
Series View: series_name.lrvar(options)
Options
window=arg | Type of long-run covariance to compute: “sym” (symmetric), “lower” (lower - lags in columns), “slower” (strict lower - lags only), “upper” (upper - leads in columns), “supper” (strict upper - leads only) |
noc | Do not remove means (center data) prior to whitening. |
out=arg | Name of output sym or matrix (optional) |
panout=arg | Name of ee output matrix (optional). |
prompt | Force the dialog to appear from within a program. |
p | Print results. |
Whitening Options
lag=arg | Lag specification: integer (user-specified number of lags), “a” (automatic selection). |
infosel=arg (default=“aic”) | Information criterion for automatic selection: “aic” (Akaike), “sic” (Schwarz), “hqc” (Hannan-Quinn) (if “lag=a”). |
maxlag=integer | Maximum lag-length for automatic selection (optional) (if “lag=a”). The default is an observation-based maximum of  . |
Kernel Options
kern=arg (default=“bart”) | Kernel shape: “none” (no kernel), “bart” (Bartlett, default), “bohman” (Bohman), “daniell” (Daniel), “parzen” (Parzen), “parzriesz” (Parzen-Riesz), “parzgeo” (Parzen-Geometric), “parzcauchy” (Parzen-Cauchy), “quadspec” (Quadratic Spectral), “trunc” (Truncated), “thamm” (Tukey-Hamming), “thann” (Tukey-Hanning), “tparz” (Tukey-Parzen), “user” (User-specified; see “kernwgt=” below). |
kernwgt=vector | User-specified kernel weight vector (if “kern=user”). |
bw=arg (default=”nwfixed”) | Bandwidth: “fixednw” (Newey-West fixed), “andrews” (Andrews automatic), “neweywest” (Newey-West automatic), number (User-specified bandwidth). |
nwlag=integer | Newey-West lag-selection parameter for use in nonparametric bandwidth selection (if “bw=neweywest”). |
bwoffset=integer (default=0) | Apply integer offset to bandwidth chosen by automatic selection method (“bw=andrews” or “bw=neweywest”). |
bwint | Use integer portion of bandwidth chosen by automatic selection method (“bw=andrews” or “bw=neweywest”). |
Examples
ser1.lrvar(out=outsym)
computes the symmetric long-run variance of the series SER1 and saves the results in the output sym matrix OUTSYM.
ser1.lrvar(kern=quadspec, bw=andrews)
computes the long-run variance SER1 using the quadratic spectral kernel, Andrews automatic bandwidth.
ser1.lrvar(kern=quadspec, lag=3, bw=andrews)
performs the same calculation but uses AR(3) prewhitening prior to computing the kernel estimator.
ser1.lrvar(kern=none, window=upper, lag=a, infosel=aic, bw=neweywest, rwgt=res)
computes parametric VAR estimates of the upper long-run variance using an AIC based automatic lag-length prewhitening procedure, Newey-West bandwidth selection, and row weight series RES.
Cross-references
Save the scores from a principal components analysis of a panel series.
Syntax
series_name.makepanpcomp(options) output_list
where the
output_list is a list of names identifying the saved components. EViews will save the first

components corresponding to the

elements in
output_list, up to the total number of series in the group.
Options
scale=arg (default=“normload”) | Diagonal matrix scaling of the loadings and the scores: normalize loadings (“normload”), normalize scores (“normscores”), symmetric weighting (“symmetric”), user-specified (arg=number). |
cpnorm | Compute the normalization for the score so that cross-products match the target (by default, EViews chooses a normalization scale so that the moments of the scores match the target). |
eigval=vec_name | Specify name of vector to hold the saved the eigenvalues in workfile. |
eigvec=mat_name | Specify name of matrix to hold the save the eigenvectors in workfile. |
prompt | Force the dialog to appear from within a program. |
Covariance Options
period | Compute period (within cross-section) panel covariances and related statistics. The default is to compute contemporaneous (between cross-section) measures. |
cov=arg (default=“corr”) | Covariance calculation method: ordinary (Pearson product moment) covariance (“cov”), ordinary correlation (“corr”), Spearman rank covariance (“rcov”), Spearman rank correlation (“rcorr”), uncentered ordinary correlation (“ucorr”). Note that Kendall’s tau measures are not valid methods. |
pairwise | Compute using pairwise deletion of observations with missing cases (pairwise samples). |
df | Compute covariances with a degree-of-freedom correction accounting for the estimation of the mean (for centered specifications). The default behavior in these cases is to perform no adjustment ( e.g. – compute sample covariance dividing by  rather than  ). |
Examples
ser1.makepanpcomp(eigval=v1, eigvec=m1) comp1 comp2 comp3
saves the first three principal components (in normalized loadings form) of the panel series SER1 to the workfile. The components will have variances that are proportional to the eigenvalues of the contemporaneous correlation matrix. In addition, the vector V1 and matrix M1 will contain the eigenvectors and eigenvalues of the decomposition.
smpl 1990 2010
ser.makepanpcomp(period, cov=rcorr, scale=normscore) comp1
saves the first principal component of the period (within cross-section) Spearman rank correlations. The scores will be normalized so that the variances of the scores are equal to 1.
Cross-references
To display the results of the panel principal components decomposition, see
Series::panpcomp.
Save wavelet decomposition results to the workfile.
Syntax
Series View: series_name.makewaveobj(options)
Options
Basic Options
proc=arg (default=“decomp”) | Wavelet analysis type: “decomp” (transform), “anova” (variance decomposition), “outlier” (outlier detection), “threshold” (threshold - denoising). |
Wavelet Transform Options
transform=arg (default=“dwt”) | Wavelet transform type: “dwt” (discrete wavelet transform – DWT), “modwt” (maximum overlap DWT – MODWT), “mra” (DWT multiresolution analysis – DWT MRA), or “momra” (MODWT MRA). Note that when performing DWT or MRA, if the series length is not dyadic, a dyadic fix may be set with the “fixlen=” option |
fixlen=arg (default=“mean”) | Fix dyadic lengths in DWT and MRA transforms: “zeros” (pad remainder with zeros), “mean” (pad remainder with mean of series), “median” (pad remainder with median of series), “shorten” (cut series length to dyadic length preceding series length). |
maxscale=integer (default = max possible) | Maximum scale for wavelet transform. The max possible is obtained as follows. Let  denote the series length and decompose  into its dyadic component and a remainder:  ,  . The default maxscale  is then set with the following rules: DWT: (1) if  then  , otherwise (2) if expanding the series,  and (3) if contracting the series  . MODWT:  . |
filter=arg (default=“h”) | Wavelet filter class: “h” (Haar), “d” (Daubechies), “la” (least asymmetric). If “filter=h” or “filter=la”, the filter length may be specified using “flen=”. Wavelet filter boundary conditions are specified using the “bound=” option |
flen=integer | Wavelet filter excess length as an even number between 2 and 20. For use when “filter=d” (default= 4) or “filter=la” (default=8). |
bound=arg (default = “p”) | Filter boundary handling: “p” (periodic), “r” (reflective). |
basename=arg (default is series name) | Basename for output: 1. When “transform=dwt” or “transform=modwt”: Wavelet coefficient output will be saved in vectors with names given by basename followed by “_w#” where “#” is the scale level. Scaling coefficient output will be saved in vectors with names given by basename followed by “_v#” where “#” is the scale level. 2. When “transform=mra” or “transform=momra”: Detail output will be saved in vectors with names given by basename followed by “_d#” where “#” is the scale level. Smooth output will be saved in vectors with names given by basename followed by “_s#” where “#” is the scale level. |
Wavelet Variance Decomposition Options
variance=arg (default = “nobias”) | Wavelet variance type: “nobias” (unbiased variance), “bias” (biased variance). |
ci=arg (default = “none”) | Confidence interval type: “none” (no CIs computed), “gauss” (asymptotic normal), “chisq” (asymptotic chi-square), “blimit” (band-limited). |
cilevel=arg (default = 0.95) | Confidence interval coverage as a number between 0 and 1. |
transform=arg (default=“dwt”) | Wavelet transform type: “dwt” (discrete wavelet transform – DWT), “modwt” (maximum overlap DWT – MODWT). Note that when performing DWT, if the series length is not dyadic, a dyadic fix may be set with the “fixlen=” option |
fixlen=arg (default=“mean”) | Fix dyadic lengths in DWT and MRA transforms: “zeros” (pad remainder with zeros), “mean” (pad remainder with mean of series), “median” (pad remainder with median of series), “shorten” (cut series length to dyadic length preceding series length). |
maxscale=integer (default = max possible) | Maximum scale for wavelet transform. The max possible is obtained as follows. Let  denote the series length and decompose  into its dyadic component and a remainder:  ,  . The default maxscale  is then set with the following rules: DWT: (1) if  then  , otherwise (2) if expanding the series,  and (3) if contracting the series  . MODWT:  . |
filter=arg (default=“h”) | Wavelet filter class: “h” (Haar), “d” (Daubechies), “la” (least asymmetric). If “filter=h” or “filter=la”, the filter length may be specified using “flen=”. Wavelet filter boundary conditions are specified using the “bound=” option |
flen=integer | Wavelet filter excess length as an even number between 2 and 20. For use when “filter=d” (default= 4) or “filter=la” (default=8). |
bound=arg (default = “p”) | Filter boundary handling: “p” (periodic), “r” (reflective). |
basename=arg (default is series name) | Basename for variance output. Variance output will be saved in vector with name given by basename followed by “_var”. Confidence interval output will be saved in matrix with name given by basename followed by “_varci”. |
Wavelet Threshold and Outlier Options
threshtype=arg (default = “soft”) | Wavelet threshold type: “hard” (hard thresholding), “soft” (soft thresholding). |
threshlim=arg (default = “universal”) | Wavelet threshold limit type: “universal” (universal), “adaptive” (universal adaptive), “minimax” (minimax), “sureshrink” (SureShrink), “fdr” (false discovery rate). If “threshlim=sureshrink”, the grid length may be specified using “ssglen=”. If “threshlim=fdr”, the significance level may be specified using “fdrsig=” |
wavevar=arg (default = “gauss”) | Wavelet coefficient variance method: “mean” (mean absolute deviation), “gauss” (median absolute deviation with Gaussian adjustment), “median” (median absolute deviation), “meanmedian” (mean median absolute deviation). |
sslen=arg (default = 10) | Grid length used in determining the SureShrink limit. |
fdrsig=arg (default = .05) | Significance level as a number between 0 and 1 for false discovery rate limit determination. |
transform=arg (default=“dwt”) | Wavelet transform type: “dwt” (discrete wavelet transform – DWT), “modwt” (maximum overlap DWT – MODWT). Note that when performing DWT, if the series length is not dyadic, a dyadic fix may be set with the “fixlen=” option |
fixlen=arg (default=“mean”) | Fix dyadic lengths in DWT and MRA transforms: “zeros” (pad remainder with zeros), “mean” (pad remainder with mean of series), “median” (pad remainder with median of series), “shorten” (cut series length to dyadic length preceding series length). |
maxscale=integer (default = max possible) | Maximum scale for wavelet transform. The max possible is obtained as follows. Let  denote the series length and decompose  into its dyadic component and a remainder:  ,  . The default maxscale  is then set with the following rules: DWT: (1) if  then  , otherwise (2) if expanding the series,  and (3) if contracting the series  . MODWT:  . |
filter=arg (default=“h”) | Wavelet filter class: “h” (Haar), “d” (Daubechies), “la” (least asymmetric). If “filter=h” or “filter=la”, the filter length may be specified using “flen=”. Wavelet filter boundary conditions are specified using the “bound=” option |
flen=integer | Wavelet filter excess length as an even number between 2 and 20. For use when “filter=d” (default= 4) or “filter=la” (default=8). |
bound=arg (default = “p”) | Filter boundary handling: “p” (periodic), “r” (reflective). |
Outlier Output Options
basename=arg (default is series name) | Basename for outlier output (when “proc=outlier”). Output will be saved in vectors with name given by basename followed by “_olr#” where “#” is the scale level. |
Threshold Output Options
basename=arg (default is series name) | Basename for threshold output (when “proc = threshold”): Fit (signal) output will be saved in vector with name given by basename followed by “_sig_th”. Noise output will be saved in vector with name given by basename followed by “_res_th”. Threshold coefficient output will be saved in vectors with names given by basename followed by “_w#_th” (threshold coefficients), and “_v#” (scaling coefficients) where “#” is the scale level. |
Examples
srs.makewaveobj(base=out)
creates vectors OUT_W1, OUT_W2,
etc., and OUT_V1, OUT_V2,
etc., associated with the wavelet coefficients

and scaling coefficients

from the DWT using a Haar filter.
srs.makewaveobj(transform=modwt, filter=d, flen=6, base=out)
creates vectors OUT_V1, OUT_V2,
etc., associated with the scaling coefficients

from the MODWT using a Daubechies filter of length 6.
srs.makewaveobj(proc=anova, maxscale=2, fixlen=median, base=out)
creates the vector OUT_VAR with containing variance decomposition per scale using a DWT with maximum scale 2, and a series length adjustment by padding with median values of the series SRS.
srs.makewaveobj(proc=outlier, base=out)
creates vectors OUT_OLR1, OUT_OLR1, etc. with outlier identifiers using a DWT, Haar filter, soft threshold, universal threshold limit, and Gaussian median computation for the wavelet coefficient variance.
srs.makewaveobj(proc=threshold, transform=modwt, threshtype=hard, threshlim=sureshrink, base=OUT)
creates a vector OUT_SIG_TH containing values for the thresholded series, a vector OUT_RES_TH containing noise values from the thresholding procedure, and vectors OUT_W1_TH, OUT_W2_TH,
etc. and OUT_W1_TH, CVEC_W2_TH associated with the thresholded wavelet coefficients

and the original scaling coefficient

for the series SRS. The underlying computation uses a MODWT with a Haar filter, a hard threshold with a SureShrink threshold limit.Cross-references
Examples
Whiten the series.
Estimate an AR(

), compute the residuals, and save the results into a whitened series.
Syntax
Series View: series_name.makewhiten(options) out_specification
where out_name is either a name for the output series or a wildcard expression. Note that a wildcard may not be used if the original group contains series expressions.
Options
lag=arg (default=1) | Lag specification: integer (user-specified number of lags), “a” (automatic selection). |
noc | Do not remove means (center data) prior to whitening. |
infosel=arg (default=“aic”) | Information criterion for automatic selection: “aic” (Akaike), “sic” (Schwarz), “hqc” (Hannan-Quinn). |
maxlag=integer | Maximum lag-length for automatic selection (optional). The default is an observation-based maximum of the integer portion of  . |
prompt | Force the dialog to appear from within a program. |
Examples
ser1.makewhiten(lag=a, infosel=sic, maxlag=10) *a
whitens the series in GRP1 using a VAR with auto-selected number of lags based on the SIC information criterion and a maximum of 10 lags. The resulting series is named ASER1.
ser1.makewhiten(noc, lag=5) aser1
whitens the series using a no-constant VAR and 5 lags.
Cross-references
See
“Make Whitened” for details.
Assign or remove value map setting.
Syntax
series_name.map [valmap_name]
If the optional valmap name is provided, the procedure will assign the specified value map to the series. If no name is provided, EViews will remove an existing valmap assignment.
Examples
series1.map mymap
assigns the valmap object MYMAP to SERIES1.
series1.map
removes an existing valmap assignment from SERIES1.
Cross-references
See
“Value Maps” for a discussion of valmap objects in EViews.
Seasonally adjust series using the movereg method.
movereg is only available for weekly data.
Syntax:
series.movereg(options) [@ao additiveoutliers] [@ls levelshiftoutliers] [@holiday holiday(holiday weighting)] [@user userregs]
You should follow the movereg command with any additive or level-shift outliers, holiday events or user variables to be included as part of the procedure. Outliers are specified as full dates or in "weeknumber year" format. Holidays are specified with one of the built-in holiday keywords, followed by its holiday weighting pattern. Available holiday keywords are: "easter", "labor", "newyear", "memorial", "taxday", "christmas", "july4th", "february", "thanksgiving", "mlking", "veterans", and "columbus".
Options
Sa=name | Specify the name of the output seasonal adjusted data. If not specified the output series will be the name of the underlying series with an appended _sa |
Facname=name | Specify the name of the output seasonal factors. If not specified the output series will be the name of the underlying series with an appended _saf |
Holname=name | Specify the name of the output holiday series. |
Outname=name | Specify the name of the output outlier series. |
Nfilt=integer | Specify the width of the detrending filter. Default is 2. |
Nfs=integer | Specify number of trigonometric terms. Default is 60. Must be a positive even integer. |
phi=number | Specify the AR coefficient. Default is 0.4. |
Sigr=number | Specify the variance ratio parameter. Default is 16. |
Examples
icnsa.movereg
Performs movereg seasonal adjustment on the series ICNSA, saving the adjusted data and factors under the default names ICNSA_SA and ICNSA_SAF.
icnsa.movereg(outname=icnsa_hol) @ao 37 2001 @holiday christmas(5, 4, 1, 1, 1, 2, 2)
Performs a seasonal adjustment with the 37th week of 2001 as an additive outlier, and specifying an adjustment for Christmas, where the Christmas effect is felt over 5 weeks, 3 weeks before Christmas through one after, with the week of Christmas and after Christmas having slightly more weight. The output holiday series is stored under ICNSA_HOL.
Push updates to OLE linked objects in open applications.
Syntax
series_name.olepush
Cross-references
See
“Object Linking and Embedding (OLE)” for a discussion of using OLE with EViews.
Detect outlying observations.
Use Tukey fences, mean/standard deviation fences, wavelet outliers, or ARMA outliers detection methods to identify observations that deviate from the natural pattern of the underlying series.
Syntax
series_name.outliers(options)
Options
hp | Perform the Hodrick-Prescott filter on the series, and then detect outliers on the cycle series. |
diff | First-difference the series before detecting outliers. |
sens=arg | Set the sensitivity level. Valid arguments are “low”, “medium” (default), and “high”. |
nofence | Do not perform Tukey and mean/standard deviation fences. |
nowave | Do not perform Wavelet Outlier detection. |
arma | Perform ARMA based outlier detection (this option is turned on by default in dated workfiles). |
noarma | Do not perform ARMA based outlier detection (this option is turned on by default in undated workfiles). |
tukeyk=arg | Set the value k in the Tukey fence detection routine. This will override the value of k set by the sens= option. |
meanstdevk=arg | Set the value k in the mean/standard deviation fence detection routine. This will override the value of k set by the sens= option. |
wavesig=arg | Set the value false discovery rate significance value used in the Wavelet Outlier detection routine. This will override the value set by the sens= option. |
armac=arg | Set the value c in the ARMA outlier detection routine. This will override the value of c set by the sens= option. |
setsmpl | Set the workfile sample to be any observations identified as outliers. |
excludesmpl | Set the workfile sample to be any observations identified as not outliers. |
series=name | Create a new series in the workfile, named name, containing a value of 1 for any observations identified as an outlier, and a value of 0 for any observation identified as not an outlier. |
datestring=name | Create a new string object in the workfile containing the dates (or observation identifiers) for any observations identified as an outlier. |
nogrlabels | Turn off observation labels on the outlier graph. |
prompt | Force the dialog to appear from within a program. |
p | Print results. |
Examples
gdpc1.outliers(hp, nowave, sens=high, meanstdevk=3)
Performs outlier detection on the cycle series from a Hodrick-Prescott filter of the GDPC1 series, opting to not use Wavelet Outlier detection, and setting the sensitivity of the detection to "high", but overwriting the k value used in the mean/standard deviation fence to 3.
Cross-references
Compute covariances, correlations, and other measures of association for a panel series.
You may compute measures related to Pearson product-moment (ordinary) covariances and correlations, Spearman rank covariances, or Kendall’s tau along with test statistics for evaluating whether the correlations are equal to zero.
Syntax
series_name.pancov(options) [keywords]
By default, EViews will compute the contemporaneous (between cross-section) covariances, correlations and related statistics for the panel series. You may use the “period” option to instruct EViews to compute the between period (within cross-section) measures.
You should specify keywords indicating the statistics you wish to display from the list below.
You may specify keywords from one of the four sets (Pearson correlation, Spearman rank correlation, Kendall’s tau, Uncentered Pearson) corresponding the computational method you wish to employ. (You may not select keywords from more than one set.)
If you do not specify keywords, EViews will assume “cov” and compute the Pearson covariance matrix.
Pearson Correlation
cov | Product moment covariance. |
corr | Product moment correlation. |
sscp | Sums-of-squared cross-products. |
stat | Test statistic (t-statistic) for evaluating whether the correlation is zero. |
prob | Probability under the null for the test statistic. |
cases | Number of cases. |
obs | Number of observations. |
Spearman Rank Correlation
rcov | Spearman’s rank covariance. |
rcorr | Spearman’s rank correlation. |
rsscp | Sums-of-squared cross-products. |
rstat | Test statistic (t-statistic) for evaluating whether the correlation is zero. |
rprob | Probability under the null for the test statistic. |
cases | Number of cases. |
obs | Number of observations. |
Kendall’s tau
taub | Kendall’s tau-b. |
taua | Kendall’s tau-a. |
taucd | Kendall’s concordances and discordances. |
taustat | Kendall’s score statistic for evaluating whether the Kendall’s tau-b measure is zero. |
tauprob | Probability under the null for the score statistic. |
cases | Number of cases. |
obs | Number of observations. |
Uncentered Pearson
ucov | Product moment covariance. |
ucorr | Product moment correlation. |
usscp | Sums-of-squared cross-products. |
ustat | Test statistic (t-statistic) for evaluating whether the correlation is zero. |
uprob | Probability under the null for the test statistic. |
cases | Number of cases. |
obs | Number of observations. |
Note that cases and obs are available for each of the methods.
Options
period | Compute period (within cross-section) panel covariances and related statistics. The default is to compute contemporaneous (between cross-section) measures. |
pairwise | Compute using pairwise deletion of observations with missing cases (pairwise samples). |
df | Compute covariances with a degree-of-freedom correction for the mean (for centered specifications). |
multi=arg (default=“none”) | Adjustment to p-values for multiple comparisons: none (“none”), Bonferroni (“bonferroni”), Dunn-Sidak (“dunn”). |
outfmt=arg (default= “single”) | Output format: single table (“single”), multiple table (“mult”), list (“list”), spreadsheet (“sheet”). Note that “outfmt=sheet” is only applicable if you specify a single statistic keyword. |
out=name | Basename for saving output. All results will be saved in Sym matrices named using keys (“COV”, “CORR”, “SSCP”, “TAUA”, “TAUB”, “CONC” (Kendall’s concurrences), “DISC” (Kendall’s discordances), “CASES”, “OBS”, “WGTS”) appended to the basename (e.g., the covariance specified by “out=my” is saved in the Sym matrix “MYCOV”). |
prompt | Force the dialog to appear from within a program. |
p | Print the result. |
Examples
ser1.pancov
displays the contemporaneous Pearson covariance matrix of SER1 using the cross-sections in sample.
ser1.pancov corr stat prob
displays a table containing the contemporaneous Pearson correlation matrix for SER1, along with t-statistics for testing for zero correlation, and associated p-values,.
smpl 1990 2010
ser1.pancov(period, pairwise) taub taustat tauprob
computes the between period Kendall’s tau-b, score statistic, and p-value for the score statistic, for the periods in the sample “1990 2010” using samples with pairwise missing value exclusion.
ser1.pancov(out=aa, list) cor
computes the contemporaneous Pearson correlation for the series SER1, displays it in list form, and saves the results in the symmetric matrix object AACORR.
Cross-references
To display the results of the panel principal components decomposition, see
Series::panpcomp.
See
Group::cor for the command to compute these measures across series.
Panel principal components analysis.
Syntax
group_name.(options) [indices]
where the elements to display in loadings, scores, and biplot graph form (“out=loadings”, “out=scores” or “out=biplot”) are given by the optional indices, (e.g., “1 2 3” or “2 3”). If indices is not provided, the first two elements will be displayed.
Basic Options
out=arg (default=“table”) | Output type: eigenvector/eigenvalue table (“table”), eigenvalues graph (“graph”), loadings graph (“loadings”), scores graph (“scores”), biplot (“biplot”). |
eigval=vec_name | Specify name of vector to hold the saved the eigenvalues in workfile. |
eigvec=mat_name | Specify name of matrix to hold the save the eigenvectors in workfile. |
prompt | Force the dialog to appear from within a program. |
p | Print results. |
Table and Eigenvalues Plot Options
The number of elements to display in the table and eigenvalue graph form is given by the minimum of the elements specified using the “n=”, “mineigen=” and “cproport=” options.
The default eigenvalue graph shows a scree plot of the ordered eigenvalues. You may use the “scree”, “cproport”, and “diff” option keywords to display any combination of the scree plot, cumulative eigenvalue proportions plot, or eigenvalue difference plot.
n=arg (default=all) | Maximum number of components. |
mineigen=arg (default=0) | Minimum eigenvalue. |
cproport=arg (default=1.0) | Cumulative proportion of eigenvalue total to attain. |
scree | Display a scree plot of the eigenvalues (if “output=graph). |
diff | Display a graph of the eigenvalue differences (if “output=graph). |
cproport | Display a graph of the cumulative proportions (if “output=graph). |
Loadings, Scores, Biplot Graph Options
scale=arg, (default= “normload”) | Diagonal matrix scaling of the loadings and the scores: normalize loadings (“normload”), normalize scores (“normscores”), symmetric weighting (“symmetric”), user-specified (arg=number). |
cpnorm | Compute the normalization for the scores so that cross-products match the target (by default, EViews chooses a normalization scale so that the moments of the scores match the target). |
nocenter | Do not center the elements in the graph. |
mult=arg (default=”first”) | Multiple graph options: first versus remainder (“first”), pairwise (“pair”), all pairs arrayed in lower triangle (“lt”) |
labels=arg (default=“outlier”) | Scores label options: identify outliers only (“outlier”), all points (“all”), none (“none”). |
labelprob=arg (default=0.1) | Outlier label probability (if “labels=outlier”). |
autoscale=arg (default=1.0) | Rescaling factor for auto-scaling. |
userscale=arg | User-specified scaling. |
Covariance Options
period | Compute period (within cross-section) panel covariances and related statistics. The default is to compute contemporaneous (between cross-section) measures. |
cov=arg (default=“corr”) | Covariance calculation method: ordinary (Pearson product moment) covariance (“cov”), ordinary correlation (“corr”), Spearman rank covariance (“rcov”), Spearman rank correlation (“rcorr”), uncentered ordinary correlation (“ucorr”). Note that Kendall’s tau measures are not valid methods. |
pairwise | Compute using pairwise deletion of observations with missing cases (pairwise samples). |
df | Compute covariances with a degree-of-freedom correction accounting for the mean (for centered specifications). The default behavior in these cases is to perform no adjustment ( e.g. – compute sample covariance dividing by  rather than  ). |
Examples
ser1.panpcomp(eigval=v1, eigvec=m1)
computes the principal components decomposition of the contemporaneous (between cross-section) Pearson correlation matrix for the series SER1.
The output view is stored in a table named tab1, the eigenvalues in a vector named v1, and the eigenvectors in a matrix named m1.
ser1.panpcomp(out=graph)
ser2.panpcomp(out=graph, scree, cproport)
displays a screen plot of the eigenvalues, and a graph containing both a screen plot and a plot of the cumulative eigenvalue proportions.
ser.panpcomp(period, cov=rcorr, out=loading)
displays a loadings plot for the principal component decomposition of the period (within cross-section) Spearman rank correlation matrix, and
ser.panpcomp(period, cov=rcorr, out=biplot, scale=symmetric, mult=lt) 1 2 3
displays a symmetric biplot of the period Spearman correlation matrix for all three pairwise comparisons.
Cross-references
To compute principal components scores and save them in series in the workfile, see
Series::makepanpcomp.
Performs Facebook’s Prophet forecasting on the underlying series.
Prophet requires the Prophet Python library installed with EViews.
Syntax
series_name.prophet(options) forecast_name [lower_name upper_name]
Enter a name for the forecast series, and optionally, a name for the lower and upper bounds of the forecast.
Options
cpscale=number | Set the change point prior scale. |
growth=arg | Set the growth type. arg can be “linear” (default) or “log”. |
season=arg | Set the seasonality type. arg can be “add” (additive, default) or “mult” (multiplicative). |
f=arg | Out-of-forecast-sample fill behavior: “actual” (fill observations outside the forecast sample with actual values for the fitted variable), “na” (fill observations outside the forecast sample with missing values, default), or “forc” (fill training-data observations with in-sample forecasts, and other data with NA). |
prompt | Force the dialog to appear from within a program. |
Forecast sample options
The forecast sample will start at the observation immediately after the estimation sample (the current workfile sample). The forecast endpoint is given by either:
forclen=int | Number of periods to forecast. |
forc=“date” | Specify the date of the forecast end point. |
If omitted, the end point will be the end of the workfile range.
Examples
elecdmd.prophet(f=actual) elec_f elec_l elec_u
This will execute the Facebook Prophet routine on the ELECDMD series, inserting the actual values for out-of-forecast sample observations. The forecasted values will be stored in the new series ELEC_F, with the lower and upper bounds to the forecast being stored in ELEC_L and ELEC_U respectively.
Cross-references
Resample from observations in a series.
Syntax
series_name.resample(options) [output_spec]
You should follow the resample keyword and options with, if desired, an output_spec containing a list of names or a wildcard expression identifying the series to hold the output. If a list is used to identify the targets, the number of target series must match the number of names implied by the keyword.
Options
outsmpl= smpl_spec | Sample to fill the new series. Either provide the sample range in double quotes or specify a named sample object. The default is the current workfile sample. |
permute | Draw from rows without replacement. Default is to draw with replacement. |
weight= series_name | Name of series to be used as weights. The weight series must have non-missing, non-negative values in the current workfile sample. If no weights are specified, observations will be drawn with equal probability weights. |
block=integer (default = 1) | Block length for each draw. Must be a positive integer. The default block length is 1. |
withna (default) | [Draw / Do not draw] from all rows in the current sample, including those with NAs. |
dropna | Do not draw from rows that contain missing values in the current workfile sample. |
fixna | Excludes NAs from draws but copies rows containing missing values to the output series. |
prompt | Force the dialog to appear from within a program. |
• You may not use this proc with an auto-series unless you provide an output_spec. For example, resampling from X(–1) or LOG(X) without providing explicit output names will produce an error since we will attempt to append a suffix to the original name, producing an invalid object name.
• Block bootstrap (block length larger than 1) requires a continuous output sample. Therefore a block length larger than 1 cannot be used together with the “fixna” option, and the “outsmpl” should not contain any gaps.
• The “fixna” option will have an effect only if there are missing values in the overlapping sample of the input sample (current workfile sample) and the output sample specified by “outsmpl”.
• If you specify “fixna”, we first copy any missing values in the overlapping sample to the output series. Then the input sample is adjusted to drop rows containing missing values and the output sample is adjusted so as not to overwrite the copied values.
• If you choose “dropna” and the block length is larger than 1, the input sample may shrink in order to ensure that there are no missing values in any of the drawn blocks.
• If you choose “permute”, the block option will be reset to 1, the “dropna” and “fixna” options will be ignored (reset to the default “withna” option), and the “weight” option will be ignored (reset to default equal weights).
Examples
ser1.resample
creates a new series SER1_B by drawing with replacement from the rows of SER1 in the current workfile sample. If SER1_B already exists in the workfile, it will be overwritten if it is a series objects, otherwise EViews will error. Note that only values of SER_B (in this case the current workfile sample) will be overwritten.
ser1.resample(weight=wt,suffix=_2)
will append “_2” to the SER1 for the name of the new series, SER_2. The rows in the sample will be drawn with probabilities proportional to the corresponding values in the series WT. WT must have non-missing non-negative values in the current workfile sample.
Cross-references
See
“Resample” for a discussion of the resampling procedure. For additional discussion of wildcards, see
Appendix A. “Wildcards”.
See also
@resample and
@permute for sampling from matrices.
Seasonal adjustment.
The seas command carries out seasonal adjustment using either the ratio to moving average, or the difference from moving average technique.
EViews also performs Census X11, Census X12, and Census X-13ARIMA-SEATS seasonal adjustment. For details, see
Series::x11,
Series::x12, and
Series::x13.
Syntax
series_name.seas(options) name_adjust [name_fac]
Options
m | Multiplicative (ratio to moving average) method. |
a | Additive (difference from moving average) method. |
prompt | Force the dialog to appear from within a program. |
Examples
sales.seas(m) adj_sales
seasonally adjusts the series SALES using the multiplicative method and saves the adjusted series as ADJ_SALES.
Cross-references
See
“Seasonal Adjustment” for a discussion of seasonal adjustment methods.
Carries out seasonal unit root tests on a series.
Computes Hylleberg, Engle, Granger, and Yoo (HEGY, 1990) test, Smith and Taylor (1998) likelihood HEGY test, Canova and Hansen (CH, 1995), and Taylor (2005) HEGY variance ratio tests.
Syntax
series_name.seasuroot(options)
Options
type = arg (default= “hegy”) | Test type: HEGY (“hegy”), HEGY likelihood (“lklhd”), Canova-Hansen (“ch”), HEGY variance ratio (“hegyvr”). |
out= arg | Output matrix name (optional). |
Basic Specification
periods = arg | Periodicity: “2”, “4”, “5”, “6”, or “12”. The default is workfile frequency specific: semi-annual (2), quarterly (4), bi-monthly (6), monthly (12), all others (4). |
rstrct =arg | Restrictions to test (if “test=ch”): arg = space separated list of integers, “all” (all frequencies). For example, if the number of periods is 4, the restriction “0 1 2” corresponds to the 0, harmonic pair  , and  frequencies. |
dtr = arg | Non-seasonal deterministic variables to include in estimation: “none” (no exogenous variables), “const” (constant), “trend” (constant and linear trend). The default is “const” for “type=hegyvr” and “none” for all others. |
sdtr = arg | Seasonal deterministic variables to include in estimation: “none” (no seasonal exogenous), “dum” (seasonal dummies), “const” (constant), “trend” (constant and linear trend). |
lagdep | Include lag of dependent variable in computations for Canova-Hansen test (“type = ch”). |
Lag Difference Options
Specifies the number of lag difference terms to be included in the test equation. Applicable in “Summary”, LLC, Breitung, IPS, and Fisher-ADF tests. The default setting is to perform automatic lag selection using the Schwarz criteria (“lagmethod=sic”).
lagmethod=arg (default=“sic”) | Method for selecting lag lengths (number of first difference terms) to be included in the Dickey-Fuller test regressions: “aic” (Akaike), “sic” (Schwarz), “hqc” (Hannan-Quinn), “tstat” (Ng-Perron first backward significant t-statistic). |
lag=arg | Specified lag length (number of first difference terms) to be included in the regression: integer (user-specified common lag length), vector_name (user-specific individual lag length, one row per cross-section). |
maxlag=arg | Maximum lag length to consider when performing automatic lag length selection: integer (common maximum lag length), or vector_name (individual maximum lag length, one row per cross-section). The default setting produces individual maximum lags of, default=  where  is the length of the cross-section. |
lagpval=arg (default=0.1) | Probability value for use in the t-statistic automatic lag selection method (when “lagmethod = tstat”). |
General options
prompt | Force the dialog to appear from within a program. |
p | Print output from the test. |
Examples
houst.seasuroot(dtr=trend, sdtr=dum)
runs a traditional HEGY test using seasonal dummies and trend and automatic AIC lag selection.
houst.seasuroot(type=lklhd, dtr=trend, sdtr=trend, info=sic)
runs likelihood HEGY test using spectral intercepts and trends and automatic SIC lag selection.
airline.seasuroot(type=ch, sdtr=const, rstrct=0 6, lagdep)
does Canova-Hansen test for frequency 0 and PI, and add lag of dependent variable as regressor.
Cross-references
See
“Seasonal Unit Root Testing” for a discussion of seasonal unit root testing.
Declare a series object.
The series command creates and optionally initializes a series, or modifies an existing series.
Syntax
series ser_name[=formula]
The
series command should be followed by either the name of a new series, or an explicit or implicit expression for generating a series. If you create a series and do not initialize it, the series will be filled with NAs. Rules for composing a formula are given in
“Numeric Expressions”.
Examples
series x
creates a series named X filled with NAs.
Once a series is declared, you do not need to include the series keyword prior to entering the formula. The following example generates a series named LOW that takes value 1 if either INC is less than or equal to 5000 or EDU is less than 13, and 0 otherwise.
series low
low = inc<=5000 or edu<13
This example solves for the implicit relation and generates a series named Z which is the double log of Y so that Z=log(log(Y)).
series exp(exp(z)) = y
The command:
series z = (x+y)/2
creates a series named Z which is the average of series X and Y.
series cwage = wage*(hrs>5)
generates a series named CWAGE which is equal to WAGE if HRS exceeds 5, and zero otherwise.
series 10^z = y
generates a series named Z which is the base 10 log of Y.
The commands:
series y_t = y
smpl if y<0
y_t = na
smpl @all
generate a series named Y_T which replaces negative values of Y with NAs.
series z = @movav(x(+2),5)
creates a series named Z which is the centered moving average of the series X with two leads and two lags.
series z = (.5*x(6)+@movsum(x(5),11)+.5*x(-6))/12
generates a series named Z which is the centered moving average of the series X over twelve periods.
genr y = 2+(5-2)*rnd
creates a series named Y which is a random draw from a uniform distribution between 2 and 5.
series y = 3+@sqr(5)*nrnd
generates a series named Y which is a random draw from a normal distribution with mean 3 and variance 5.
Cross-references
There is an extensive set of functions that you may use with series:
See
“Numeric Expressions” for a discussion of rules for forming EViews expressions.
Set the object attribute.
Syntax
series_name.setattr(attr) attr_value
Sets the attribute attr to attr_value. Note that quoting the arguments may be required. Once added to an object, the attribute may be extracted using the @attr data member.
Examples
a.setattr(revised) never
String s = a.@attr("revised")
sets the “revised” attribute in the object A to the string “never”, and extracts the attribute into the string object S.
Cross-references
Set frequency conversion method.
Determines the default frequency conversion method for a series when copied or linked between different frequency workfiles.
You may override this default conversion method by specifying a frequency conversion method as an option in the specific command (using
copy or
fetch or
Link::linkto).
If you do not set a conversion method and if you do not specify a conversion method as an option in the command, EViews will use the conversion method set in the global option.
Syntax
ser_name.setconvert [up_method down_method]
Follow the series name with a period, the keyword, and option letters to specify the frequency conversion method. If either the up-conversion or down-conversion method is omitted, EViews will set the corresponding method to .
Options
The following options control the frequency conversion method when copying series and group objects to a workfile, converting from low to high frequency:
Low to high conversion methods | “r” (constant match average), “d” (constant match sum), “q” (quadratic match average), “t” (quadratic match sum), “i” (linear match last), “c” (cubic match last). |
The following options control the frequency conversion method when copying series and group objects to a workfile, converting from high to low frequency:
High to low conversion methods | High to low conversion methods removing NAs: “a” (average of the nonmissing observations), “s” (sum of the nonmissing observations), “f” (first nonmissing observation), “l” (last nonmissing observation), “x” (maximum nonmissing observation), “m” (minimum nonmissing observation). High to low conversion methods propagating NAs: “an” or “na” (average, propagating missings), “sn” or “ns” (sum, propagating missings), “fn” or “nf” (first, propagating missings), “ln” or “nl” (last, propagating missings), “xn” or “nx” (maximum, propagating missings), “mn” or “nm” (minimum, propagating missings). |
Examples
unemp.setconvert a
sets the default down-conversion method of the series UNEMP to take the average of nonmissing observations, and resets the up-conversion method to use the global default.
ibm_hi.setconvert xn d
sets the default down-conversion method for IBM_HI to take the largest observation of the higher frequency observations, propagating missing values, and the default up-conversion method to constant, match sum.
consump.setconvert
resets both methods to the global default.
Cross-references
See
“Frequency Conversion” for a discussion of frequency conversion and the treatment of missing values.
See also
copy and
fetch, and
Link::linkto.
Set the fill (background) color used in the series spreadsheet using values in the spreadsheet or in a different series.
Syntax
series_name.setfillcolor(t=type) fill_color_args
where:
type = arg | Type of fill coloring for spreadsheet cells: “single” (single color), “posneg” (positive-negative single threshold), “range” (single range coloring), “hilo” (high-low-median), “custom” (custom coloring). |
General Arguments
To specify the series or expression whose values will determine the background color:
• mapser(spec)
where spec is a series name or expression.
To specify the minimum and maximum values where the coloring begins and ends:
• min(color_arg)
• max(color_arg)
To set the missing value (NA) background color:
• naclr(color_arg)
where
color_arg is described below in
“Color definitions”. If omitted, the color defaults to “white”.
Type-specific Arguments
There are optional type-specific arguments that correspond to each of the type choices:
Single color
To set the single background color:
clr(color_arg)
where
color_arg is described below in
“Color definitions”. If omitted, the color defaults to “white”.
Positive-negative single threshold
You may set the color for both the non-negative (posclr) and the negative (negclr) values
posclr(color_arg)
negclr(color_arg)
where
color_arg is described below in
“Color definitions”. If omitted, the non-negative color defaults to “white” and the negative color defaults to light-red.
Single range
To specify the range, you must specify the range endpoints:
range(lower_val, upper_val[, range_def)
where range_def specifies the range endpoints:
cright | closed on the right only |
cboth | closed on both sides |
cleft | closed on the left only |
oboth | open on both sides |
By default, the range will be open on the lower and closed on the upper threshold limits.
You should provide a color specification for the inside range color (inclr) and outside range color (outclr):
inclr(color_arg)
outclr(color_arg)
where
color_arg is described below in
“Color definitions”. If omitted, the interior color defaults to light-red, and the exterior defaults to white.
High-Low-Median
When “type=hilo” you may specify the high, low, and median coloring values:
highclr(color_arg)
lowclr(color_arg)
medianclr(color_arg)
where
color_arg is described below in
“Color definitions”. If omitted, the colors default to light-red.
Custom
When “type=custom” you may specify custom coloring options.
You may optionally set a base background color, and then add one or more custom threshold or range color specifications. Multiple threshold and range specifications will layer, with the first applied first, followed by the second, and so on.
Custom Base Color
To set the base color (optional):
clr(color_arg)
as described below in
“Color definitions”. If omitted, the color defaults to “white”.
Custom Threshold
To add a threshold specification:
thresh(limit(threshold_value, threshold_spec), lowclr(below_arg), highclr(above_arg), threshold_name])
where threshold_spec is one of
cright | closed on the right |
cleft | closed on the left |
and the below_arg and above_arg are one of
color_arg | solid color specification |
@grad(color_arg) | gradient using color specification |
@trans | transparent |
and
color_arg are as described below in
“Color definitions”. If omitted, the color defaults to “white”.
The optional threshold_name argument may be used to attach a name to the corresponding definition.
Custom Range
To add a range specification:
range(limit(low_value, high_value, range_spec), inclr(inside_arg), outclr(outside_arg)[, range_name])
where range_spec is one of
cright | closed on the right only |
cboth | closed on both sides |
cleft | closed on the left only |
oboth | open on both sides |
inside_arg is one of
color_arg | solid color specification |
@grad(color_arg1, color_arg2) | gradient using color specification, where color_arg1 and color_arg2 are the low and high colors, respectively. |
@trans | transparent |
outside_arg is one of
color_arg | solid color specification |
@grad(color_arg) | gradient using color specification |
@trans | transparent |
color_arg1 and
color_arg2 are as described below in
“Color definitions”.
The optional range_name argument may be used to attach a name to the corresponding definition.
Color definitions
color_arg specifies the color to be employed in the arguments above. The color may be specified using predefined color names, by specifying the individual red-green-blue (RGB) components using the special “@RGB” function, or by specifying the individual red-green-blue (RGB) components in hexadecimal using the special “@HEX” function.
The predefined colors are given by the keywords (with their RGB and HEX equivalents):
blue | @rgb(0, 0, 255) | @hex(0000ff) |
red | @rgb(255, 0, 0) | @hex(ff0000) |
green | @rgb(0, 128, 0) | @hex(ffa8a8) |
black | @rgb(0, 0, 0) | @hex(008000) |
white | @rgb(255, 255, 255) | @hex(000000) |
purple | @rgb(128, 0, 128) | @hex(ffffff) |
orange | @rgb(255, 128, 0) | @hex(800080) |
yellow | @rgb(255, 255, 0) | @hex(ff8000) |
gray | @rgb(128, 128, 128) | @hex(ffff00) |
ltgray | @rgb(192, 192, 192) | @hex(808080) |
Examples
To set a gray background color for all cells in the spreadsheet, you may use:
myser.setfillcolor(type=single) clr(gray)
To set a background color for negative values, you may use
myser.setfillcolor(type=posneg) mapser(ser1)
which sets the background sheet fill color to white for non-negative values and light red for negative values of SER1.
Similarly,
myser.setfillcolor(type=posneg) mapser(ser1) posclr(@rgb(10, 20, 30)) negclr(purple)
sets the background sheet fill color to @rgb(10, 20, 30) for non-negative values and purple for negative values of SER1.
Range coloring may be specified using the “type=range” option. The command
myser.setfillcolor(type=range) mapser(ser1) clr(ltgray) range(10, 20, cleft) inclr(@rgb(128, 0, 128)) outclr(ltred) naclr(green)
sets the background fill to @rgb(128, 0, 128) for values between 10 and 20, light-red to values outside of the range 10 to 20, and green, for missing values.
Custom coloring allows you to construct more complex background filling:
myser.setfillcolor(type=custom) mapser(ser1) clr(@rgb(10, 0, 0)) range(limit(-10, 10, oboth), inclr(green), outclr(white))) thresh(limit(-1, oleft), highclr(grey), lowclr(@trans))
Cross-references
Set the display format for cells in a series object spreadsheet view.
Syntax
series_name.setformat format_arg
where format_arg is a set of arguments used to specify format settings. If necessary, you should enclose the format_arg in double quotes.
For series, setformat operates on all of the cells in the series.
To format numeric values, you should use one of the following format specifications:
g[.precision] | significant digits |
f[.precision] | fixed decimal places |
c[.precision] | fixed characters |
e[.precision] | scientific/float |
p[.precision] | percentage |
r[.precision] | fraction |
To specify a format that groups digits into thousands using a comma separator, place a “t” after the format character. For example, to obtain a fixed number of decimal places with commas used to separate thousands, use “ft[.precision]”.
To use the period character to separate thousands and commas to denote decimal places, use “..” (two periods) when specifying the precision. For example, to obtain a fixed number of characters with a period used to separate thousands, use “ct[..precision]”.
If you wish to display negative numbers surrounded by parentheses (i.e., display the number -37.2 as “(37.2)”), you should enclose the format string in “()” (e.g., “f(.8)”).
To format numeric values using date and time formats, you may use a subset of the possible date format strings (see
“Date Formats”). The possible format arguments, along with an example of the date number 730856.944793113 (January 7, 2002 10:40:30.125 p.m) formatted using the argument are given by:
WF | (uses current EViews workfile period display format) |
YYYY | “2002” |
YYYY-Mon | “2002-Jan” |
YYYYMon | “2002 Jan” |
YYYY[M]MM | “2002[M]01” |
YYYY:MM | “2002:01” |
YYYY[Q]Q | “2002[Q]1” |
YYYY:Q | “2002:Q |
YYYY[S]S | “2002[S]1” (semi-annual) |
YYYY:S | “2002:1” |
YYYY-MM-DD | “2002-01-07” |
YYYY Mon dd | “2002 Jan 7” |
YYYY Month dd | “2002 January 7” |
YYYY-MM-DD HH:MI | “2002-01-07 22:40” |
YYYY-MM-DD HH:MI:SS | “2002-01-07 22:40:30” |
YYYY-MM-DD HH:MI:SS.SSS | “2002-01-07 22:40:30.125” |
Mon-YYYY | “Jan-2002” |
Mon dd YYYY | “Jan 7 2002” |
Mon dd, YYYY | “Jan 7, 2002” |
Month dd YYYY | “January 7 2002” |
Month dd, YYYY | “January 7, 2002” |
MM/DD/YYYY | “01/07/2002” |
mm/DD/YYYY | “1/07/2002” |
mm/DD/YYYY HH:MI | “1/07/2002 22:40” |
mm/DD/YYYY HH:MI:SS | “1/07/2002 22:40:30” |
mm/DD/YYYY HH:MI:SS.SSS | “1/07/2002 22:40:30.125” |
mm/dd/YYYY | “1/7/2002” |
mm/dd/YYYY HH:MI | “1/7/2002 22:40” |
mm/dd/YYYY HH:MI:SS | “1/7/2002 22:40:30” |
mm/dd/YYYY HH:MI:SS.SSS | “1/7/2002 22:40:30.125” |
dd/MM/YYYY | “7/01/2002” |
dd/mm/YYYY | “7/1/2002” |
DD/MM/YYYY | “07/01/2002” |
dd Mon YYYY | “7 Jan 2002” |
dd Mon, YYYY | “7 Jan, 2002” |
dd Month YYYY | “7 January 2002” |
dd Month, YYYY | “7 January, 2002” |
dd/MM/YYYY HH:MI | “7/01/2002 22:40” |
dd/MM/YYYY HH:MI:SS | “7/01/2002 22:40:30” |
dd/MM/YYYY HH:MI:SS.SSS | “7/01/2002 22:40:30.125” |
dd/mm/YYYY hh:MI | “7/1/2002 22:40” |
dd/mm/YYYY hh:MI:SS | “7/1/2002 22:40:30” |
dd/mm/YYYY hh:MI:SS.SSS | “7/1/2002 22:40:30.125” |
hm:MI am | “10:40 pm“ |
hm:MI:SS am | “10:40:30 pm” |
hm:MI:SS.SSS am | “10:40:30.125 pm” |
HH:MI | “22:40” |
HH:MI:SS | “22:40:30” |
HH:MI:SS.SSS | “22:40:30.125” |
hh:MI | “22:40” |
hh:MI:SS | “22:40:30” |
hh:MI:SS.SSS | “22:40:30.125” |
Note that the “hh” formats display 24-hour time without leading zeros. In our examples above, there is no difference between the “HH” and “hh” formats for 10 p.m.
Also note that all of the “YYYY” formats above may be displayed using two-digit year “YY” format.
Examples
To set the format for all cells in the series to fixed 5-digit precision, simply provide the format specification:
ser1.setformat f.5
Other format specifications include:
ser1.setformat f(.7)
ser1.setformat e.5
You may use any of the date formats given above:
ser1.setformat YYYYMon
ser1.setformat "YYYY-MM-DD HH:MI:SS.SSS"
to set the series display characteristics.
Cross-references
See
Series::setwidth,
Series::setindent and
Series::setjust for details on setting spreadsheet widths, indentation and justification.
Set the display indentation for cells in a series object spreadsheet view.
Syntax
series_name.setindent indent_arg
where indent_arg is an indent value specified in 1/5 of a width unit. The width unit is computed from representative characters in the default font for the current spreadsheet (the EViews spreadsheet default font at the time the spreadsheet was created), and corresponds roughly to a single character. Indentation is only relevant for non-center justified cells.
The default indentation setttings are taken from the Global Defaults for spreadsheet views (
“Spreadsheet Data Display”) at the time the spreadsheet was created.
For series, setindent operates on all of the cells in the series.
Examples
To set the indentation for a series object:
ser1.setindent 2
Cross-references
See
Series::setwidth and
Series::setjust for details on setting spreadsheet widths and justification.
Set the horizontal justification for all cells in the spreadsheet view of the series.
Syntax
series_name.setjust format_arg
where
format_arg may be set to left, center, right, or auto (strings are left-justified and numbers are right-justified). Default display settings can be set in General Options; see
“Spreadsheet Data Display”.
Examples
ser1.setjust left
left-justifies the cells in the spreadsheet view of the series SER1.
Cross-references
See
Series::setwidth and
Series::setindent for details on setting spreadsheet widths and indentation.
Set the text color used in the series spreadsheet using values in the spreadsheet or in a different series.
Syntax
series_name.settextcolor(t=type) text_color_args
where:
type = arg | Type of fill coloring for spreadsheet cells: “single” (single color), “posneg” (positive-negative single threshold), “range” (single range coloring), “hilo” (high-low-median), “custom” (custom coloring). |
General Arguments
To specify the series or expression whose values will determine the background color:
• mapser(spec)
where spec is a series name or expression.
To specify the minimum and maximum values where the coloring begins and ends:
• min(color_arg)
• max(color_arg)
To set the missing value (NA) background color:
• naclr(color_arg)
where
color_arg is described below in
“Color definitions”. If omitted, the color defaults to “black”.
Type-specific Arguments
There are optional type-specific arguments that correspond to each of the type choices:
Single color
To set the single text color:
clr(color_arg)
where
color_arg is described below in
“Color definitions”. If omitted, the color defaults to “black”.
Positive-negative single threshold
You may set the color for both the non-negative (posclr) and the negative (negclr) values
posclr(color_arg)
negclr(color_arg)
where
color_arg is described below in
“Color definitions”. If omitted, the non-negative color defaults to “black” and the negative color defaults to “red”.
Single range
To specify the range, you must specify the range endpoints:
range(lower_val, upper_val[, range_def)
where range_def specifies the range endpoints:
cright | closed on the right only |
cboth | closed on both sides |
cleft | closed on the left only |
oboth | open on both sides |
By default, the range will be open on the lower and closed on the upper threshold limits.
You should provide a color specification for the inside range color (inclr) and outside range color (outclr):
inclr(color_arg)
outclr(color_arg)
where
color_arg is described below in
“Color definitions”. If omitted, the interior color defaults to light-red, and the exterior defaults to white.
High-Low-Median
When “type=hilo” you may specify the high, low, and median coloring values:
highclr(color_arg)
lowclr(color_arg)
medianclr(color_arg)
where
color_arg is described below in
“Color definitions”. If omitted, the colors default to light-red.
Custom
When “type=custom” you may specify custom coloring options.
You may optionally set a base text color, and then add one or more custom threshold or range color specifications. Multiple threshold and range specifications will layer, with the first applied first, followed by the second, and so on.
Custom Base Color
To set the base color (optional):
clr(color_arg)
as described below in
“Color definitions”. If omitted, the color defaults to “white”.
Custom Threshold
To add a threshold specification:
thresh(limit(threshold_value, threshold_spec), lowclr(below_arg), highclr(above_arg), threshold_name])
where threshold_spec is one of
cright | closed on the right |
cleft | closed on the left |
and the below_arg and above_arg are one of
color_arg | solid color specification |
@grad(color_arg) | gradient using color specification |
@trans | transparent |
and
color_arg are as described below in
“Color definitions”. If omitted, the color defaults to “white”.
The optional threshold_name argument may be used to attach a name to the corresponding definition.
Custom Range
To add a range specification:
range(limit(low_value, high_value, range_spec), inclr(inside_arg), outclr(outside_arg)[, range_name])
where range_spec is one of
cright | closed on the right only |
cboth | closed on both sides |
cleft | closed on the left only |
oboth | open on both sides |
inside_arg is one of
color_arg | solid color specification |
@grad(color_arg1, color_arg2) | gradient using color specification, where color_arg1 and color_arg2 are the low and high colors, respectively. |
@trans | transparent |
outside_arg is one of
color_arg | solid color specification |
@grad(color_arg) | gradient using color specification |
@trans | transparent |
color_arg1 and
color_arg2 are as described below in
“Color definitions”.
The optional range_name argument may be used to attach a name to the corresponding definition.
Color definitions
color_arg specifies the color to be employed in the arguments above. The color may be specified using predefined color names, by specifying the individual red-green-blue (RGB) components using the special “@RGB” function, or by specifying the individual red-green-blue (RGB) components in hexadecimal using the special “@HEX” function.
The predefined colors are given by the keywords (with their RGB and HEX equivalents):
blue | @rgb(0, 0, 255) | @hex(0000ff) |
red | @rgb(255, 0, 0) | @hex(ff0000) |
ltred | @rgb(255, 168, 168) | @hex(ffa8a8) |
green | @rgb(0, 128, 0) | @hex(008000) |
black | @rgb(0, 0, 0) | @hex(000000) |
white | @rgb(255, 255, 255) | @hex(ffffff) |
purple | @rgb(128, 0, 128) | @hex(800080) |
orange | @rgb(255, 128, 0) | @hex(ff8000) |
yellow | @rgb(255, 255, 0) | @hex(ffff00) |
gray | @rgb(128, 128, 128) | @hex(808080) |
ltgray | @rgb(192, 192, 192) | @hex(c0c0c0) |
Examples
To set a gray text color for all cells in the spreadsheet, you may use:
myser.settextcolor(type=single) clr(gray)
To set a text color for negative values, you may use
myser.settextcolor(type=posneg) mapser(ser1)
which sets the text color to black for non-negative values and red for negative values of SER1.
Similarly,
myser.settextcolor(type=posneg) mapser(ser1) posclr(@rgb(10, 20, 30)) negclr(purple)
sets the text color to @rgb(10, 20, 30) for non-negative values and purple for negative values of SER1.
Range coloring may be specified using the “type=range” option. The command
myser.settextcolor(type=range) mapser(ser1) clr(ltgray) range(10, 20, cleft) inclr(@rgb(128, 0, 128)) outclr(ltred) naclr(green)
sets the text to @rgb(128, 0, 128) for values between 10 and 20, light-red to values outside of the range 10 to 20, and green, for missing values.
Custom coloring allows you to construct more complex text coloring:
myser.settextcolor(type=custom) mapser(ser1) clr(@rgb(10, 0, 0)) range(limit(-10, 10, oboth), inclr(green), outclr(white))) thresh(limit(-1, oleft), highclr(grey), lowclr(@trans))
Cross-references
Set the column width for a series spreadsheet.
Syntax
series_name.setwidth width_arg
where width_arg specifies the width unit value. The width unit is computed from representative characters in the default font for the current spreadsheet (the EViews spreadsheet default font at the time the spreadsheet was created), and corresponds roughly to a single character. width_arg values may be non-integer values with resolution up to 1/10 of a width unit.
Examples
ser1.setwidth 12
sets the width of series SER1 to 12 width units.
Cross-references
See
Series::setindent and
Series::setjust for details on setting spreadsheet indentation and justification.
Spreadsheet view of a series object.
Syntax
series_name.sheet(options)
Options
w | Wide. In a panel this will switch to the unstacked form of the panel (dates along the side, cross-sections along the top). |
t | Transpose. |
a | All observations (ignore sample) |
nl | Do not display labels. |
tform=arg (default= “default” | Display transformed data: value mapped or date formated (when applicable) or raw data, otherwise (“default”), raw data (“level”), one period difference (“dif” or “d”), annual difference (“dify” or “dy”), one period percentage change (“pch” or “pc”), annualized one period percentage change (“pcha” or “pca”), annual percentage change (“pchy” or “pcy”), natural logarithm (“log”), one period difference of logged values (“dlog”). |
p | Print the spreadsheet view. |
Examples
ser1.sheet(p)
displays and prints the default spreadsheet view of series SER1.
ser1.sheet(t, tform=log)
displays log values of SER1 in the current sample in a wide spreadsheet.
ser1.sheet(nl, tform=diff)
shows differenced values of the series without labels.
ser1.sheet(a, tform=pc)
displays the one period percent changes for all observations in the workfile.
Cross-references
See
“Basic Data Handling” for a discussion of the spreadsheet view of series and groups.
Exponential smoothing.
Forecasts a series using one of a number of exponential smoothing techniques. By default, smooth estimates the damping parameters of the smoothing model to minimize the sum of squared forecast errors, but you may specify your own values for the damping parameters.
smooth automatically calculates in-sample forecast errors and puts them into the series RESID.
Syntax
series_name.smooth(method) smooth_name [freq]
You should follow the smooth keyword with a name for the smoothed series. You must also specify the smoothing method in parentheses. The optional freq may be used to override the default for the number of periods in the seasonal cycle. By default, this value is set to the workfile frequency (e.g. — 4 for quarterly data). For undated data, the default is 5.
Options
Smoothing method options
s[,x] | Single exponential smoothing for series with no trend. You may optionally specify a number x between zero and one for the mean parameter. |
d[,x] | Double exponential smoothing for series with a trend. You may optionally specify a number x between zero and one for the mean parameter. |
n[,x,y] (default) | Holt-Winters without seasonal component. You may optionally specify numbers x and y between zero and one for the mean and trend parameters, respectively. |
a[,x,y,z] | Holt-Winters with additive seasonal component. You may optionally specify numbers x, y, and z, between zero and one for the mean, trend, and seasonal parameters, respectively. |
m[,x,y,z] | Holt-Winters with multiplicative seasonal component. You may optionally specify numbers x, y, and z, between zero and one for the mean, trend, and seasonal parameters, respectively. |
Other Options:
prompt | Force the dialog to appear from within a program. |
p | Print a table of forecast statistics. |
If you wish to set only some of the damping parameters and let EViews estimate the other parameters, enter the letter “e” where you wish the parameter to be estimated.
If the number of seasons is different from the frequency of the workfile (an unusual case that arises primarily if you are using an undated workfile for data that are not monthly or quarterly), you should enter the number of seasons after the smoothed series name. This optional input will have no effect on forecasts without seasonal components.
Examples
sales.smooth(s) sales_f
smooths the SALES series by a single exponential smoothing method and saves the smoothed series as SALES_F. EViews estimates the damping (smoothing) parameter and displays it with other forecast statistics in the SALES series window.
tb3.smooth(n,e,.3) tb3_hw
smooths the TB3 series by a Holt-Winters no seasonal method and saves the smoothed series as TB3_HW. The mean damping parameter is estimated while the trend damping parameter is set to 0.3.
smpl @first @last-10
order.smooth(m,.1,.1,.1) order_hw
smpl @all
graph gra1.line order order_hw
show gra1
smooths the ORDER series by a Holt-Winters multiplicative seasonal method leaving the last 10 observations. The damping parameters are all set to 0.1. The last three lines plot and display the actual and smoothed series over the full sample.
Cross-references
See
“Exponential Smoothing” for a discussion of exponential smoothing methods. See also
Series::ets.
Change display order for series spreadsheet.
The sort command changes the sort order settings for spreadsheet display of the series.
Syntax
series_name.sort([opt])
By default, EViews will sort by the value of the series, in ascending order. For purposes of sorting, NAs are considered to be smaller than any other value.
You may modify the default sort order by providing a sort option. If you provide the integer “0”, or the keyword “obs”, EViews will sort using the original workfile observation order. To sort in descending order, simply include the minus sign (“‑”).
Examples
ser1.sort
change the display order for the series SER1 so that spreadsheet rows are ordered from low to high values of the series.
ser1.sort(-)
sorts in descending order.
ser1.sort(obs)
returns the display order for group SER1 to the original (by observation).
Cross-references
See
“Spreadsheet” for additional discussion.
Basic statistics by classification.
The statby view displays descriptive statistics for the elements of a series classified into categories by one or more series.
Syntax
series_name.statby(options) classifier_list
You should follow the series name with a period, the statby keyword, and a name (or a list of names) for the series or groups by which to classify.
The options control which statistics to display and in what form. By default, statby displays the means, standard deviations, and counts for the series.
Options
Options to control statistics to be displayed
sum | Display sums. |
med | Display medians. |
max | Display maxima. |
min | Display minima. |
quant=arg (default=.5) | Display quantile with value given by the argument. |
q=arg (default=“r”) | Compute quantiles using the specified definition: “b” (Blom), “r” (Rankit-Cleveland), “o” (Ordinary), “t” (Tukey), “v” (van der Waerden), “g” (Gumbel). |
skew | Display skewness. |
kurt | Display kurtosis. |
na | Display counts of NAs. |
nomean | Do not display means. |
nostd | Do not display standard deviations. |
nocount | Do not display counts. |
Options to control layout
l | Display in list mode (for more than one classifier). |
nor | Do not display row margin statistics. |
noc | Do not display column margin statistics. |
nom | Do not display table margin statistics (unconditional tables); for more than two classifier series. |
nos | Do not display sub-margin totals in list mode; only used with “l” option and more than two classifier series. |
sp | Display sparse labels; only with list mode option, “l”. |
Options to control binning
dropna (default), keepna | [Drop/Keep] NA as a category. |
v=integer (default=1000) | Bin categories if classification series take on more than the specified number of distinct values. |
nov | Do not bin based on the number of values of the classification series. |
a=number (default=2) | Bin categories if average cell count is less than the specified number. |
noa | Do not bin based on the average cell count. |
b=integer (default=5) | Set maximum number of binned categories. |
nolimit | Remove prompt warning for continuing when the total number of cells is very large. |
Other options
prompt | Force the dialog to appear from within a program. |
p | Print the descriptive statistics table. |
Examples
wage.statby(max, min) sex race
displays the mean, standard deviation, maximum, and minimum of the series WAGE by (possibly binned) values of SEX and RACE.
group g1 sex race state
wage.statby(max, min) g1
shows the mean, standard deviation, maximum, and minimum of the series WAGE by (possibly binned) values of SEX, race, and STATE.
Cross-references
See
“By-Group Statistics” for a list of functions to compute by-group statistics. See also
“Stats by Classification” for discussion.
Descriptive statistics.
Computes and displays a table of means, medians, maximum and minimum values, standard deviations, and other descriptive statistics of the series.
Syntax
series_name.stats(options)
Options
Examples
wage.stats
displays the descriptive statistics view of the series WAGE.
Cross-references
See
“Descriptive Statistics & Tests” for a discussion of the descriptive statistics views of series.
Seasonally adjust series using the STL decomposition method.
Unlike other seasonal adjustment methods used by EViews, this procedure works on any time frequency.
Syntax:
series.stl(options) seas_name [trend_name]
You should follow the stl keyword with a name for the seasonally adjusted series. Optionally, you may also provide a name for the output trend series.
Options
periodicity =arg | Specify the periodicity. Use “w” to expand weekly data to 53 weeks and “d” to expand daily data to 366 (in a 7 day week workfile) or 261 (in a 5 day week workfile) days. Default is the number of periods per year (expanded for weekly and daily). |
sp=integer | Specify the seasonal polynomial degree. Default is 0. |
tp=integer | Specify the trend polynomial degree. Default is 1. |
fp=integer | Specify the filter polynomial degree. Default is 1. |
sl=integer | Specify the length of the seasonal smoothing window (odd integers only). Default is 35. |
tl=integer | Specify the length of the trend smoothing window (odd integers only). Default is based upon the seasonal smoothing window length. |
fl=integer | Specify the length of the filter smoothing window (odd integers only). Default is based upon the data frequency. |
inits=integer | Specify number of inner iterations. Default is 5. |
outits=integer | Specify the number of outer iterations. Default is 15. |
estsmpl=arg | Set the estimation sample. |
forclen=integer | Set the length of the forecast. |
seasdiagnostic | Display seasonality diagnostics graph. |
Examples
co2.stl co2_sa c02_trend
performs STL decomposition on the series C02, saving the adjusted data in the series C02_SA and the trend in C02_TREND.
show co2.stl(sl=20, outits=20, seasdiagnostic)
performs the same decomposition, but with a seasonal smoothing window of 20, using 20 iterations of the outer loop, and displays the seasonal diagnostics graphs.
Test equality of the mean, median, or variance of a series across categories defined by the row values of series or groups.
Syntax
series_name.testby(options) arg1 [arg2 arg2 …]
Follow the testby keyword by a list of the names of series or groups to use as classifiers.
By default, testby will test for equality of means, but you may specify instead tests of medians or variances as an option, choose whether to use balanced or unbalanced samples, and control binning.
Options
mean (default) | Test equality of means. |
med | Test equality of medians. |
var | Test equality of variances. |
dropna (default), keepna | [Drop /Keep] NAs as a classification category. |
v=integer (default=1000) | Bin categories if classification series take more than the specified number of distinct values. |
nov | Do not bin based on the number of values of the classification series. |
a=number (default=2) | Bin categories if average cell count is less than the specified number. |
noa | Do not bin on the basis of average cell count. |
b=integer (default=5) | Set maximum number of binned categories. |
nolimit | Remove prompt warning for continuing when the total number of cells is very large. |
prompt | Force the dialog to appear from within a program. |
p | Print the test results. |
Examples
wage.testby(a=10) state
tests equality of means of WAGE across groups classified by state, with binning of the average cell cound is less than 10.
wage.testby(med, nov) stores
tests equality of medians of WAGE across groups classified by STORES, with no automatic binning on the basis of the number of unique STORES values.
Cross-references
See
“Equality Tests by Classification” for a discussion of equality tests.
Test simple hypotheses of whether the mean, median, or variance of a series are equal to specific values.
Syntax
series_name.teststat(options)
Specify the type of test and the value under the null hypothesis as an option. You must specify at least one hypothesis.
For tests of means, you may either estimate the variance or specify the variance as an option.
Options
mean=number | Test the null hypothesis that the mean equals the specified number. |
med=number | Test the null hypothesis that the median equals the specified number. |
var=number | Test the null hypothesis that the variance equals the specified number. The number must be positive. |
std=number | Test equality of mean conditional on the specified standard deviation. The standard deviation must be positive. |
prompt | Force the dialog to appear from within a program. |
p | Print the test results. |
Examples
smpl @all
lwage.teststat(mean=7)
tests the null hypothesis that the mean of LWAGE is equal to 7, using an estimated standard deviation.
lwage.teststat(mean=7, std=2)
tests the null that the mean is 7, using an estimated standard deviation, and also assuming that the standard deviation is known to be 2.
smpl if race=1
lwage.teststat(var=4)
tests the null hypothesis that the variance of LWAGE is equal to 4 for the subsample with RACE=1.
Cross-references
See
“Descriptive Statistics & Tests” for a discussion of simple hypothesis tests.
Run the external seasonal adjustment program Tramo/Seats using the data in the series.
tramoseats is available for annual, semi-annual, quarterly, and monthly series. The procedure requires at least

observations and can adjust up to 600 observations where:
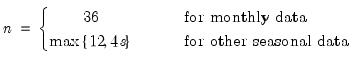 | (1.4) |
Syntax
series_name.tramoseats(options) [base_name]
Enter the name of the original series followed by a dot, the keyword, and optionally provide a base name (no more than 20 characters long) to name the saved series. The default base name is the original series name. The saved series will have postfixes appended to the base name.
Options
runtype=arg (default=“ts”) | Tramo/Seats Run Specification: “ts” (run Tramo followed by Seats; the “opt=” options are passed to Tramo, and Seats is run with the input file returned from Tramo), “t” (run only Tramo), “s” (run only Seats). |
save=arg | Specify series to save in workfile: you must use one or more from the following key word list: “hat” (forecasts of original series), “lin” (linearized series from Tramo), “pol” (interpolated series from Tramo), “sa” (seasonally adjusted series from Seats), “trd” (final trend component from Seats), “ir” (final irregular component from Seats), “sf” (final seasonal factor from Seats), “cyc” (final cyclical component from Seats). To save more than one series, separate the list of key words with a space. Do not use commas within the list of save series. The special key word “save=*” will save all series in the key word list. The five key words “sa”, “trd”, “ir”, “sf”, “cyc” will be ignored if “runtype=t”. |
opt=arg | A space delimited list of input namelist. Do not use commas within the list. The syntax for the input namelist is explained in the.PDF documentation file. See also
“Notes”. |
reg=arg | A space delimited list for one line of reg namelist. Do not use commas within the list. This option must be used in pairs, either with another “reg=” option or “regname=” option. The reg namelist is available only for Tramo and its syntax is explained in the PDF documentation file. See also
“Notes”. |
regname=arg | Name of a series or group in the current workfile that contains the exogenous regressors specified in the previous “ reg=” option. See
“Notes”. |
prompt | Force the dialog to appear from within a program. |
p | Print the results of the Tramo/Seats procedure. |
Notes
The command line interface to Tramo/Seats does very little error checking of the command syntax. EViews simply passes on the options you provide “as is” to Tramo/Seats. If the syntax contains an error, you will most likely to see the EViews error message “output file not found”. If you see this error message, check the input files produced by EViews for possible syntax errors as described in
“Trouble Shooting”.
Additionally, here are some of the more commonly encountered syntax errors.
• To replicate the dialog options from the command line, use the following input options in the “opt=” list. See the PDF documentation file for a description of each option.
1. data frequency: “mq=”.
2. forecast horizon: “npred=” for Tramo and “fh=” for Seats.
3. transformation: “lam=”.
4. ARIMA order search: “inic=” and “idif=”.
5. Easter adjustment: “ieast=”.
6. trading day adjustment: “itrad=”.
7. outlier detection: “iatip=” and “aio=”.
• The command option input string list must be space delimited. Do not use commas. Options containing an equals sign should not contain any spaces around the equals; the space will be interpreted as a delimiter by Tramo/Seats.
• If you set “rtype=ts”, you are responsible for supplying either “seats=1” or “seats=2” in the “opt=” option list. EViews will issue the error message “Seats.itr not found” if the option is omitted. Note that the dialog option Run Seats after Tramo sets “seats=2”.
• Each “reg=” or “regname=” option is passed to the input file as a separate line in the order that they appear in the option argument list. Note that these options must come in pairs. A “reg=” option must be followed by another “reg=” option that specifies the outlier or intervention series or by a “regname=” option that provides the name for an exogenous series or group in the current workfile. See the sample programs in the “./Example Files” directory.
• If you specify exogenous regressors with the “reg=” option, you must set the appropriate “ireg=” option (for the total number of exogenous series) in the “opt=” list.
• To use the “regname=” option, the preceding “reg=” list must contain the “user=-1” option and the appropriate “ilong=” option. Do not use “user=1” since EViews will always write data in a separate external file. The “ilong=” option must be at least the number of observations in the current workfile sample plus the number of forecasts. The exogenous series should not contain any missing values in this range. Note that Tramo may increase the forecast horizon, in which case the exogenous series is extended by appending zeros at the end.
Examples
freeze(tab1) x.tramoseats(runtype=t, opt="lam=-1 iatip=1 aio=2 va=3.3 noadmiss=1 seats=2", save=*) x
replicates the example file EXAMPLE.1 in Tramo. The output file from Tramo is stored in a text object named tab1. This command returns three series named X_HAT, X_LIN, X_POL.
show x.TramoSeats(runtype=t, opt="NPRED=36 LAM=1 IREG=3 INTERP=2 IMEAN=0 P=1 Q=0 D=0", reg="ISEQ=1 DELTA=1.0", reg="61 1", reg="ISEQ=8 DELTAS=1.0", reg="138 5 150 5 162 5 174 5 186 5 198 5 210 5 222 5", reg="ISEQ=8 DELTAS=1.0", reg="143 7 155 7 167 7 179 7 191 7 203 7 215 7 227 7") x
replicates the example file EXAMPLE.2 in Tramo. This command produces an input file containing the lines:
$INPUT NPRED=36 LAM=1 IREG=3 INTERP=2 IMEAN=0 P=1 Q=0 D=0, $
$REG ISEQ=1 DELTA=1.0$
61 1
$REG ISEQ=8 DELTAS=1.0$
138 5 150 5 162 5 174 5 186 5 198 5 210 5 222 5
$REG ISEQ=8 DELTAS=1.0$
143 7 155 7 167 7 179 7 191 7 203 7 215 7 227 7
Additional examples replicating many of the example files provided by Tramo/Seats can be found in the “./Example Files” directory. You will also find files that compare seasonal adjustments from Census X12 and Tramo/Seats.
Cross-references
See
“Tramo/Seats” for discussion. See also the Tramo/Seats documentation that accompanied your EViews distribution.
Perform tests on the existence of a trend in the series.
Calculate the linear t-test, squared F-test, Mann-Kendall test, seasonal Mann-Kendall test, Cox-Stuart test and the Wang, Akritas and Van Keilegom (WAVK) test for time series trends.
Syntax
series_name.trendtests(options)
Options
noboot | Do not calculate bootstrapped p-values. |
simple | Use the simple bootstrap. By default, the sieve bootstrap is used. |
mle | Calculate the bootstrap AR estimates using MLE. Default is to use the HVK estimates. |
iter=arg | Number of bootstrap simulations. |
seed=int | Set the random number generator seed. |
rng=arg | Set random number generator type. Available types are: improved Knuth generator (“kn”), improved Mersenne Twister (“mt”), Knuth’s (1997) lagged Fibonacci generator used in EViews 4 (“kn4”), L’Ecuyer’s (1999) combined multiple recursive generator (“le”), Matsumoto and Nishimura’s (1998) Mersenne Twister used in EViews 4 (“mt4”). |
out=name | Specify the name of the matrix containing the test statistics and p-values. |
Examples
gdpc1.trendtests(iter=19999, out=ttstats)
Performs a trend test on the GDPC1 series, performing 19,999 bootstraps using HVK estimates in a sieve bootstrap, and saving the test statistics and p-values into a matrix object named TTSTATS.
Cross-references
See
“Trend Tests” for discussion
Carries out unit root tests on a series or panel structured series.
For ordinary series, computes conventional Augmented Dickey-Fuller (ADF), GLS detrended Dickey-Fuller (DFGLS), Phillips-Perron (PP), Kwiatkowski, et. al. (KPSS), Elliot, Rothenberg, and Stock (ERS) Point Optimal, or Ng and Perron (NP) tests for a unit root in the series or its first or second difference.
For series in a panel structured workfile, computes Levin, Lin and Chu (LLC), Breitung, Im, Pesaran, and Shin (IPS), Fisher - ADF, Fisher - PP, or Hadri panel unit root tests on levels, first, or second differences of the data.
Syntax
series_name.uroot(options)
There are different options for conventional tests on an ordinary series and panel tests for series in panel structured workfiles.
Options for Conventional Unit Root Tests
Basic Specification
You should specify the exogenous variables and order of dependent variable differencing in the test equation using the following options:
exog=arg (default=“const”) | Specification of exogenous trend variables in the test equation: “const” “trend” (include a constant and a linear time trend), “none” (do not include any exogenous regressors). |
dif=integer (default=0) | Order of differencing of the series prior to running the test. Valid values are {0, 1, 2}. |
You should specify the test type using one of the following keywords:
adf (default) | Augmented Dickey-Fuller. |
dfgls | GLS detrended Dickey-Fuller (Elliot, Rothenberg, and Stock). |
pp | Phillips-Perron. |
kpss | Kwiatkowski, Phillips, Schmidt, and Shin. |
ers | Elliot, Rothenberg, and Stock (Point Optimal). |
np | Ng and Perron. |
Note that for backward compatibility, EViews supports older forms of the exogenous specification:
const, c (default) | Include a constant in the test equation. |
trend, t | Include a constant and a linear time trend in the test equation. |
none, n | Do not include a constant or time trend (only available for the ADF and PP tests). |
For future compatibility we recommend that you use the “exog=” format.
Spectral Estimation Option
In addition, PP, KPSS, ERS, and NP tests all require the estimation of the long-run variance (frequency zero spectrum). You may specify the method using the “hac=” option. The default setting depends on the selected test.
hac=arg (default=varies) | Method of estimating the frequency zero spectrum: “bt” (Bartlett kernel), “pr” (Parzen kernel), “qs” (Quadratic Spectral kernel), “ar” (AR spectral), “ardt (AR spectral - OLS detrended data), “argls” (AR spectral - GLS detrended data). The default settings are test specific (“bt” for PP and KPSS tests, “ar” for ERS, “argls” for NP). |
Lag Difference Options
Applicable to ADF and DFGLS tests, and for PP, KPSS, ERS, and NP tests that use a AR spectral density estimator (“hac=ar”, “hac=ardt”, or “hac=argls”). The default lag selection method is based on a comparison of Schwarz criterion values. You may specify a fixed lag using the “lag=” option.
lagmethod=arg (default=“sic”) | Method for selecting lag length (number of first difference terms) to be included in the Dickey-Fuller test regression or number of lags in the AR spectral density estimator: “aic” (Akaike), “sic” (Schwarz), “hqc” (Hannan-Quinn), “msaic” (Modified Akaike), “msic” (Modified Schwarz), “mhqc” (Modified Hannan-Quinn), “tstat” (Ng-Perron first backward significant t-statistic). |
lag=integer | Use-specified fixed lag. |
maxlag=integer | Maximum lag length to consider when performing automatic lag length selection. default=  |
lagpval=arg (default=0.1) | Probability value for use in the t-statistic automatic lag selection method (“lagmethod = tstat”). |
Kernel Option
Applicable to PP, KPSS, ERS, and NP tests when using kernel estimators of the frequency zero spectrum (where “hac=bt”, “hac=pz”, or “hac=qs”)
band = arg, b=arg (default=“nw”) | Method of selecting the bandwidth: “nw” (Newey-West automatic variable bandwidth selection), “a” (Andrews automatic selection), number (user specified bandwidth). |
General Options
prompt | Force the dialog to appear from within a program. |
p | Print output from the test. |
Options for Panel Unit Root Tests
Basic Specification
You should specify the exogenous variables, order of dependent variable differencing, and sample handling, in the test equation using the following options:
exog=arg (default=“const”) | Specification of exogenous trend variables in the test equation: “const” (constant),“trend” (include a constant and a linear time trend), “none” (do not include exogenous regressors). |
dif=integer (default=0) | Order of differencing of the series prior to running the test. Valid values are {0, 1, 2}. |
balance | Use balanced (across cross-sections or series) data when performing test. |
You may use one of the following keywords to specify the test:
sum (default) | Summary of all of the panel unit root tests. |
llc | Levin, Lin, and Chu. |
breit | Breitung. |
ips | Im, Pesaran, and Shin. |
adf | Fisher - ADF. |
pp | Fisher - PP. |
hadri | Hadri. |
For backward compatibility, EViews supports older forms of the exogenous specification:
const, c (default) | Include a constant in the test equation. |
trend, t | Include a constant and a linear time trend in the test equation. |
none, n | Do not include a constant or time trend (only available for the ADF and PP tests). |
For future compatibility we recommend that you use the “exog=” format.
Lag Difference Options
Specifies the number of lag difference terms to be included in the test equation. Applicable in “Summary”, LLC, Breitung, IPS, and Fisher-ADF tests. The default setting is to perform automatic lag selection using the Schwarz criteria (“lagmethod=sic”).
lagmethod=arg (default=“sic”) | Method for selecting lag lengths (number of first difference terms) to be included in the Dickey-Fuller test regressions: “aic” (Akaike), “sic” (Schwarz), “hqc” (Hannan-Quinn), “tstat” (Ng-Perron first backward significant t-statistic). |
lag=arg | Specified lag length (number of first difference terms) to be included in the regression: integer (user-specified common lag length), vector_name (user-specific individual lag length, one row per cross-section). |
maxlag=arg | Maximum lag length to consider when performing automatic lag length selection: integer (common maximum lag length), or vector_name (individual maximum lag length, one row per cross-section). The default setting produces individual maximum lags of, default= 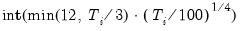 where  is the length of the cross-section. |
lagpval=arg (default=0.1) | Probability value for use in the t-statistic automatic lag selection method (when “lagmethod = tstat”). |
Kernel Options
Specifies options for computing kernel estimates of the zero-frequency spectrum (long-run covariance). Applicable to “Summary”, LLC, Fisher-PP, and Hadri tests.
hac=arg (default=“bt”) | Method of estimating the frequency zero spectrum: “bt” (Bartlett kernel), “pr” (Parzen kernel), “qs” (Quadratic Spectral kernel), |
band = arg, b=arg (default=“nw”) | Method of selecting the bandwidth: “nw” (Newey-West automatic variable bandwidth selection), “a” (Andrews automatic selection), number (user-specified common bandwidth), vector_name (user-specified individual bandwidths, one row for each cross-section). |
General options
prompt | Force the dialog to appear from within a program. |
p | Print output from the test. |
Examples
The command:
gnp.uroot(adf,exog=const,lag=3,save=mout)
performs an ADF test on the series GDP with the test equation including a constant term and three lagged first-difference terms. Intermediate results are stored in the matrix MOUT.
ip.uroot(dfgls,exog=trend,lagmethod=sic)
runs the DFGLS unit root test on the series IP with a constant and a trend. The number of lagged difference terms is selected automatically using the Schwarz criterion.
unemp.uroot(kpss,exog=const,hac=pr,b=2.3)
runs the KPSS test on the series UNEMP. The null hypothesis is that the series is stationary around a constant mean. The frequency zero spectrum is estimated using kernel methods (with a Parzen kernel), and a bandwidth of 2.3.
sp500.uroot(np,hac=ardt,lagmethod=maic)
runs the NP test on the series SP500. The frequency zero spectrum is estimated using the OLS AR spectral estimator with the lag length automatically selected using the modified AIC.
gdp.uroot(llc,hac=pr,lagmethod=aic)
runs the LLC panel unit root test on series GDP. The frequency zero spectrum is estimated using the Parzen Kernel with lag length automatically selected using the AIC.
Cross-references
See
“Unit Root Testing” for discussion of standard unit root tests performed on a single series, and
“Cross-sectionally Independent Panel Unit Root Testing” and
“Cross-sectionally Dependent Panel Unit Root Tests” for discussion of unit roots tests performed on panel structured workfiles, groups of series, or pooled data.
Compute dependent (second generation) panel unit root tests on a panel series.
Syntax
ser_name.uroot2(options)
where ser_name is the name of a series in a panel structured workfile.
Options
General Options
type=arg (default=“panic”) | Type of unit root test: PANIC - Bai and Ng (2004) (“panic”), CIPS - Pesaran (2007) (“cips”). Note: (1) when performing PANIC testing, factor selection, MQ, ADF lag selection, VAR lag selection (possibly), long-run variance (possibly), and p-value simulation options are relevant. (2) when perform CIPS testing, ADF lag selection options are relevant. |
exog=arg (default=“constant”) | Exogenous deterministic variables to include for each cross-section: “none” (no deterministic variables), “constant” (only a constant), “trend” (both a constant and trend). |
prompt | Force the dialog to appear from within a program. |
p | Print results. |
ADF Lag Selection Options
adflagmethod=arg (default=“sic”) | Method for selecting lag length (number of first difference terms) to be included in the Dickey-Fuller test regression or number of lags in the AR spectral density estimator: “aic” (Akaike), “sic” (Schwarz), “hqc” (Hannan-Quinn), “msaic” (Modified Akaike), “msic” (Modified Schwarz), “mhqc” (Modified Hannan-Quinn), “tstat” (Ng-Perron first backward significant t-statistic). |
adflag=integer | Use-specified fixed lag. |
adfmaxlag=integer | Maximum lag length to consider when performing automatic lag length selection. Note: default is Schwert’s rule: let for  and let and let 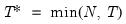 ; then the default maximum lag is given by ; then the default maximum lag is given by |
adflagpval=arg (default=0.1) | Probability value for use in the t-statistic automatic lag selection method (“lagmethod = tstat”). |
PANIC Number of Factor Selection Options
fsmethod=arg (default=“bn”) | Factor retention selection method: “bn” (Bai and Ng (2002)), “ah” (Ahn and Horenstein (2013)), “simple” (simple eigenvalue methods), “user” (user-specified value). Note the following: (1) If using simple methods, the minimum eigenvalue and cumulative proportions may be specified using “minigen=” and “cproport=”. (2) If setting “fsmethod=user” to provide a user-specified value, you must specify the value with “r=”. |
r=arg (default=1) | User-specified number of factors to retain (for use when “fsmethod=user”). |
mineigen=arg (default=0) | Minimum eigenvalue to retain factor (when “fsmethod=simple”). |
cproport=arg (default=1.0) | Cumulative proportion of eigenvalue total to attain (when “fsmethod=simple”). |
mfmethod=arg | Maximum number of factors used by selection methods: “schwert” (Schwert’s rule, default), “ah” (Ahn and Horenstein’s (2013) suggestion), “rootsize” ( 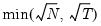 ), “size” (  ) ), “user” (user specified value). (1) For use with all factor retention methods apart from user-specified (“fsmethod=user”). (2) If setting “mfmethod=user”, you may specify the maximum number of factors using “rmax=”. (3) Schwert’s rule sets the maximum number of factors using the rule: let for  and let and let  ; then the default maximum lag is given by ; then the default maximum lag is given by |
rmax=arg (default=all) | User-specified maximum number of factors to retain (for use when “mfmethod=user”). |
fsic=arg (default=avg) | Factor selection criterion when “fsmethod=bn”: “icp1” (ICP1), “icp2” (ICP2), “icp3” (ICP3), “pcp1” (PCP1), “pcp2” (PCP1), “pcp3” (ICP3), “avg” (average of all criteria ICP1 through PCP3). Factor selection criterion when “fsmethod=ah”: “er” (eigenvalue ratio), “gr” (growth ratio), “avg” (average of eigenvalue ratio and growth ratio). Factor selection when “fsmethod=simple”: “min” (minimum of: minimum eigenvalue, cumulative eigenvalue proportion, and maximum number of factors), “max” (maximum of: minimum eigenvalue, cumulative eigenvalue proportion, and maximum number of factors), “avg” (average the optimal number of factors as specified by the min and max rule, then round to the nearest integer). |
demeantime | Demeans observations across time prior to factor selection procedures. |
sdizetime | Standardizes observations across time prior to factor selection procedures. |
demeancross | Demeans observations across cross-sections prior to factor selection procedures. |
sdizecross | Standardizes observations across cross-sections prior to factor selection procedures. |
PANIC VAR Lag Selection Options
For use when computing a PANIC test with

statistic.
varlagmethod=arg (default=“sic”) | Method for selecting lag length (number of first difference terms) to be included in the test statistic VAR: “aic” (Akaike), “sic” (Schwarz), “hqc” (Hannan-Quinn), “msaic” (Modified Akaike), “msic” (Modified Schwarz), “mhqc” (Modified Hannan-Quinn), “tstat” (Ng-Perron first backward significant t-statistic). |
varlag=integer | Use-specified fixed lag. |
varmaxlag=integer | Maximum lag length to consider when performing automatic lag length selection. Note: default is Schwert’s rule: let for  and let and let  ; then the default maximum lag is given by ; then the default maximum lag is given by |
PANIC Long-run Variance Options
For use when computing a PANIC test using the

statistic.
Whitening Options
lag=arg | Lag specification: integer (user-specified number of lags), “a” (automatic selection). |
infosel=arg (default=“aic”) | Information criterion for automatic selection: “aic” (Akaike), “sic” (Schwarz), “hqc” (Hannan-Quinn) (if “lag=a”). |
maxlag=integer | Maximum lag-length for automatic selection (optional) (if “lag=a”). The default is an observation-based maximum of  . |
Kernel Options
kern=arg (default=“bart”) | Kernel shape: “none” (no kernel), “bart” (Bartlett), “bohman” (Bohman), “daniell” (Daniel), “parzen” (Parzen), “parzriesz” (Parzen-Riesz), “parzgeo” (Parzen-Geometric), “parzcauchy” (Parzen-Cauchy), “quadspec” (Quadratic Spectral), “trunc” (Truncated), “thamm” (Tukey-Hamming), “thann” (Tukey-Hanning), “tparz” (Tukey-Parzen), “user” (User-specified; see “kernwgt=” below). |
kernwgt=vector | User-specified kernel weight vector (if “kern=user”). |
bw=arg (default=”nwfixed”) | Bandwidth: “fixednw” (Newey-West fixed), “andrews” (Andrews automatic), “neweywest” (Newey-West automatic), number (User-specified bandwidth). |
nwlag=integer | Newey-West lag-selection parameter for use in nonparametric bandwidth selection (if “bw=neweywest”). |
bwoffset=integer (default=0) | Apply integer offset to bandwidth chosen by automatic selection method (“bw=andrews” or “bw=neweywest”). |
bwint | Use integer portion of bandwidth chosen by automatic selection method (“bw=andrews” or “bw=neweywest”). |
PANIC p-value Options
mcreps=integer | Number of Monte Carlo replications. |
asymplen=integer | Asymptotic length of series. |
seed=number | Specifies the random number generator seed |
rng=arg | Specifies the type of random number generator. The key can be; improved Knuth generator (“kn”), improved Mersenne Twister (“mt”), Knuth’s (1997) lagged Fibonacci generator used in EViews 4 (“kn4”) L’Ecuyer’s (1999) combined multiple, recursive generator (“le”), Matsumoto and Nishimura’s (1998) Mersenne Twister used in EViews 4 (“mt4”). |
Examples
oecd_rer.uroot2
The line above performs a PANIC unit root test on the series OECD_RER.
oecd_rer.uroot2(fsmethod=AH, mq=mqf, varlag=3)
The line above performs a PANIC unit root test using Ahn and Horenstein (2013) for factor selection determination and the

test for the number of common trends using a VAR(3) model.
oecd_rer.uroot2(test=cips, exog=trend, adnfosel=sic)
The line above performs a CIPS unit root test on the series OECD_RER, with ADF testing performed on each cross-section with a constant and trend, and ADF lag selection using the Schwarz criterion.
Cross-references
See
“Unit Root Testing” for discussion of standard unit root tests performed on a single series, and
“Cross-sectionally Independent Panel Unit Root Testing” and
“Cross-sectionally Dependent Panel Unit Root Tests” for discussion of unit roots tests performed on panel structured workfiles, groups of series, or pooled data.
Compute the Lo and MacKinlay (1988) variance ratio test using the original data, or the Wright (2000) rank, rank-score, or sign-based forms of the test.
Multiple comparisons are handled using Wald (Richardson and Smith, 1991) or multiple comparison variance ratio (Chow and Denning, 1993). Significance levels may be computed using the asymptotic distribution, or the wild or permutation bootstrap.
Syntax
Series View: series_name.vratio(options) lag_specification
Series View: series_name.vratio(grid[, options]) start end [step]
In the first form of the command, lag_specification should contain the lag values to test in the form of a list of integers, scalars, or a vector containing integer values greater than 1.
In the second form of the command, we include the “grid” option and specify a grid of lag values in the form
start end [step]
where start is the smallest lag, end is the largest required lag, and the optional step indicates which intermediate lags to consider. By default, step is set to 1 so that all lags from start through end will be included.
Options
out=arg (default=“table”) | Output type: “table” or “graph” of test results. |
data=arg (default=“level”) | Form of data in series: “level” (random walk or martingale), “exp” (exponential random walk or martingale), “innov” (innovations to random walk or martingale). |
method=arg | Test method: “orig” (Lo-MacKinlay test statistic), “rank” (rank statistic), “rankscore” (score statistic), “sign” (sign variance ratio statistic). |
probcalc=arg (default=“anorm”) | Probability calculation: “norm” (asymptotic normal), “wildboot” (wild bootstrap), when “method=orig”. |
biased | Do not bias correct the variances. |
iid | Do not use heteroskedastic robust S.E. |
noc | Do not allow for drift / demean the data (for default “data=level”). |
stack | Compute estimates for stacked panel (in panel workfiles). |
rankties=arg (default=“a”) | Tie handling for ranks: “i” (ignore), “a” (average), “r” (randomize). |
prompt | Force the dialog to appear from within a program. |
p | Print results. |
Bootstrap Options
btreps=integer (default=1000) | Number of bootstrap repetitions |
btseed=positive_integer | Seed the bootstrap random number generator. If not specified, EViews will seed the bootstrap random number generator with a single integer draw from the default global random number generator. |
btrnd= arg (default=“kn” or method previously set using
rndseed) | Type of random number generator for the bootstrap: improved Knuth generator (“kn”), improved Mersenne Twister (“mt”), Knuth’s (1997) lagged Fibonacci generator used in EViews 4 (“kn4”) L’Ecuyer’s (1999) combined multiple recursive generator (“le”), Matsumoto and Nishimura’s (1998) Mersenne Twister used in EViews 4 (“mt4”). |
btdist=arg (default=“twopoint”) | Bootstrap distribution: “twopoint”, “rademacher”, “normal” (when “probcalc=wildboot”). |
Examples
The commands
jp.vratio(data=exp, biased, iid) 2 5 10 30
jp.vratio(out=graph, data=exp, biased, iid) 2 5 10 30
compute the Lo-MacKinley and the joint Chow-Denning and Wald tests for the homoskedastic random walk using periods 2, 5, 10, and 30. The results are displayed first in table, then in graph form. The individual test z-statistics use the asymptotic normal distribution and the Chow-Denning statistic uses the asymptotic Studentized Maximum Modulus distribution for evaluating significance.
series logjp = log(jp)
logjp.vratio(noc, iid, grid) 2 10 2
computes the same tests using periods 2, 4, 6, 8, and 10, with the bias-corrected variances computed without allowing for a mean/drift term.
To compute a heteroskedastic robust version of the last test, we simply remove the “iid” option:
logjp.vratio(noc, grid) 2 10 2
To compute the significance levels using the wild bootstrap,
jp.vratio(data=exp, biased, probcalc=wildboot, btreps=5000, btseed=1000, btrng=kn) 2 5 10 30
jp.vratio(data=exp, probcalc=wildboot, btdist=normal, btreps=5000, btseed=1000, btrng=kn) 2 5 10 30
Both commands produce bootstrap significance levels using 5000 replications with the Knuth generator and a seed of 1000. The second command substitutes bias corrects the variance estimates and changes the bootstrap random number distribution from the default two-step to the normal.
To perform Wright’s rank and rank-score based tests,
vector(4) periods
periods.fill 2, 5, 10, 30
jp.vratio(data=exp, method=rank, btreps=5000, btseed=1000, btrng=kn) periods
jp.vratio(data=exp, method=rankscore, btreps=5000, btseed=1000, btrng=mt) periods
In panel settings, you may compute the statistic on the individual cross-sections and perform a joint Fisher test
exchange.vratio(data=exp, biased, probcalc=wildboot, btreps=5000, btseed=1000, btrng=kn) periods
or you may compute the statistic on the stacked data
series dexch = @dlog(exch)
dexch.vratio(stack, data=innov) periods
Cross-references
Perform wavelet variance decomposition of the series.
Syntax
Series View: series_name.waveanova(options)
Options
Basic Options
variance=arg (default = “nobias”) | Wavelet variance type: “nobias” (unbiased variance), “bias” (biased variance). |
ci=arg (default = “none”) | Confidence interval type: “none” (no CIs computed), “gauss” (asymptotic normal), “chisq” (asymptotic chi-square), “blimit” (band-limited). |
cilevel=arg (default = 0.95) | Confidence interval coverage as a number between 0 and 1. |
prompt | Force the dialog to appear from within a program. |
p | Print results. |
Wavelet Transform Options
transform=arg (default=“dwt”) | Wavelet transform type: “dwt” (discrete wavelet transform – DWT), “modwt” (maximum overlap DWT – MODWT). Note that when performing DWT, if the series length is not dyadic, a dyadic fix may be set with the “fixlen=” option |
fixlen=arg (default=“mean”) | Fix dyadic lengths in DWT: “zeros” (pad remainder with zeros), “mean” (pad remainder with mean of series), “median” (pad remainder with median of series), “shorten” (cut series length to dyadic length preceding series length). |
maxscale=integer (default = max possible) | Maximum scale for wavelet transform. The max possible is obtained as follows. Let  denote the series length and decompose  into its dyadic component and a remainder:  ,  . The default maxscale  is then set with the following rules: DWT: (1) if  then  , otherwise (2) if expanding the series,  and (3) if contracting the series  . MODWT:  . |
filter=arg (default=“h”) | Wavelet filter class: “h” (Haar), “d” (Daubechies), “la” (least asymmetric). If “filter=h” or “filter=la”, the filter length may be specified using “flen=”. Wavelet filter boundary conditions are specified using the “bound=” option |
flen=integer | Wavelet filter excess length as an even number between 2 and 20. For use when “filter=d” (default= 4) or “filter=la” (default=8). |
bound=arg (default = “p”) | Filter boundary handling: “p” (periodic), “r” (reflective). |
Examples
dgp.waveanova(maxscale=2)
The line above will perform wavelet decomposition of variance of the series DGP using a Haar wavelet filter and the unbiased variance form, up to the second wavelet scale.
dgp.waveanova(maxscale=5, ci=gauss)
The line above will perform wavelet decomposition of variance using an unbiased variance form. It will also produce a 95% confidence interval using asymptotic Gaussian critical values.
Cross-references
Compute the wavelet transform of the series.
Syntax
Series View: series_name.wavelet(options)
Options
transform=arg (default=“dwt”) | Wavelet transform type: “dwt” (discrete wavelet transform – DWT), “modwt” (maximum overlap DWT – MODWT), “mra” (DWT multiresolution analysis – DWT MRA), or “momra” (MODWT MRA). Note that when performing DWT or MRA, if the series length is not dyadic, a dyadic fix may be set with the “fixlen=” option |
fixlen=arg (default=“mean”) | Fix dyadic lengths in DWT and MRA transforms: “zeros” (pad remainder with zeros), “mean” (pad remainder with mean of series), “median” (pad remainder with median of series), “shorten” (cut series length to dyadic length preceding series length). |
maxscale=integer (default = max possible) | Maximum scale for wavelet transform. The max possible is obtained as follows. Let  denote the series length and decompose  into its dyadic component and a remainder:  ,  . The default maxscale  is then set with the following rules: DWT: (1) if  then  , otherwise (2) if expanding the series,  and (3) if contracting the series  . MODWT:  . |
filter=arg (default=“h”) | Wavelet filter class: “h” (Haar), “d” (Daubechies), “la” (least asymmetric). If “filter=h” or “filter=la”, the filter length may be specified using “flen=”. Wavelet filter boundary conditions are specified using the “bound=” option |
flen=integer | Wavelet filter excess length as an even number between 2 and 20. For use when “filter=d” (default= 4) or “filter=la” (default=8). |
bound=arg (default = “p”) | Filter boundary handling: “p” (periodic), “r” (reflective). |
hidebound | Wavelet filter coefficients affected by the boundary will not be highlighted in the output graphs. |
prompt | Force the dialog to appear from within a program. |
p | Print results. |
Examples
dgp.wavelet(maxscale=7)
The line above will perform the discrete wavelet transform of the series DGP using a Haar wavelet filter and up to the seventh wavelet scale.
dgp.wavelet(transform=modwt, maxscale=3, lter=D)
The line above will perform the maximum overlap discrete wavelet transform using a Daubechies wavelet filter of length 4 and up to the third wavelet scale.
dgp.wavelet(transform=mra, maxscale=4, lter=la, en=10, xlen=zeros)
The line above will perform a DWT multi-resolution analysis of the series DGP using a least asymmetric wavelet filter of length 10 and up to the fourth wavelet scale. It will also fix the non-dyadic length of the series by padding with zeros.
dgp.wavelet(transform=momra, maxscale=4, filter=d, flen=12, hidebound)
The line above will perform a MODWT multi-resolution analysis using a Daubechies wavelet filter of length 12 and up to the fourth wavelet scale. It will also turn off highlighting of wavelet coefficients on the boundary.
Cross-references
Perform wavelet outlier detection for the series.
Syntax
Series View: series_name.waveoutlier(options)
Options
Basic Options
threshtype=arg (default = “soft”) | Wavelet threshold type: “hard” (hard thresholding), “soft” (soft thresholding). |
threshlim=arg (default = “universal”) | Wavelet threshold limit type: “universal” (universal), “adaptive” (universal adaptive), “minimax” (minimax), “sureshrink” (SureShrink), “fdr” (false discovery rate). If “threshlim=sureshrink”, the grid length may be specified using “ssglen=”. If “threshlim=fdr”, the significance level may be specified using “fdrsig=” |
mad=arg (default = “gauss”) | Mean/median absolute deviation: “mean” (mean absolute deviation), “gauss” (median absolute deviation with Gaussian adjustment), “median” (median absolute deviation), “meanmedian” (mean median absolute deviation). |
sslen=arg (default = 10) | Grid length used in determining the SureShrink limit. |
fdrsig=arg (default = .05) | Significance level as a number between 0 and 1 for false discovery rate limit determination. |
prompt | Force the dialog to appear from within a program. |
p | Print results. |
Wavelet Transform Options
transform=arg (default=“dwt”) | Wavelet transform type: “dwt” (discrete wavelet transform – DWT), “modwt” (maximum overlap DWT – MODWT). Note that when performing DWT, if the series length is not dyadic, a dyadic fix may be set with the “fixlen=” option |
fixlen=arg (default=“mean”) | Fix dyadic lengths in DWT: “zeros” (pad remainder with zeros), “mean” (pad remainder with mean of series), “median” (pad remainder with median of series), “shorten” (cut series length to dyadic length preceding series length). |
maxscale=integer (default = max possible) | Maximum scale for wavelet transform. The max possible is obtained as follows. Let  denote the series length and decompose  into its dyadic component and a remainder:  ,  . The default maxscale  is then set with the following rules: DWT: (1) if  then  , otherwise (2) if expanding the series,  and (3) if contracting the series  . MODWT:  . |
filter=arg (default=“h”) | Wavelet filter class: “h” (Haar), “d” (Daubechies), “la” (least asymmetric). If “filter=h” or “filter=la”, the filter length may be specified using “flen=”. Wavelet filter boundary conditions are specified using the “bound=” option |
flen=integer | Wavelet filter excess length as an even number between 2 and 20. For use when “filter=d” (default= 4) or “filter=la” (default=8). |
bound=arg (default = “p”) | Filter boundary handling: “p” (periodic), “r” (reflective). |
Examples
dgp.wavetoutlier(maxscale=1, threshtype=hard, threshlim=meanmedian)
The line above will perform the Bilen and Huzurbazar (2002) wavelet outlier detection procedure on a series called DGP. It will use the Haar wavelet filter by default, execute to single scale, will use hard thresholding, and the mean median absolute deviation for the threshold limit. The latter options are those used in the original paper.
Cross-references
Perform wavelet thresholding (denoising) of the series.
Syntax
Series View: series_name.wavethresh(options)
Options
Basic Options
threshtype=arg (default = “soft”) | Wavelet threshold type: “hard” (hard thresholding), “soft” (soft thresholding). |
threshlim=arg (default = “universal”) | Wavelet threshold limit type: “universal” (universal), “adaptive” (universal adaptive), “minimax” (minimax), “sureshrink” (SureShrink), “fdr” (false discovery rate). If “threshlim=sureshrink”, the grid length may be specified using “ssglen=”. If “threshlim=fdr”, the significance level may be specified using “fdrsig=” |
wavevar=arg (default = “gauss”) | Wavelet coefficient variance method: “mean” (mean absolute deviation), “gauss” (median absolute deviation with Gaussian adjustment), “median” (median absolute deviation), “meanmedian” (mean median absolute deviation). |
sslen=arg (default = 10) | Grid length used in determining the SureShrink limit. |
fdrsig=arg (default = .05) | Significance level as a number between 0 and 1 for false discovery rate limit determination. |
prompt | Force the dialog to appear from within a program. |
p | Print results. |
Wavelet Transform Options
transform=arg (default=“dwt”) | Wavelet transform type: “dwt” (discrete wavelet transform – DWT), “modwt” (maximum overlap DWT – MODWT). Note that when performing DWT, if the series length is not dyadic, a dyadic fix may be set with the “fixlen=” option |
fixlen=arg (default=“mean”) | Fix dyadic lengths in DWT: “zeros” (pad remainder with zeros), “mean” (pad remainder with mean of series), “median” (pad remainder with median of series), “shorten” (cut series length to dyadic length preceding series length). |
maxscale=integer (default = max possible) | Maximum scale for wavelet transform. The max possible is obtained as follows. Let  denote the series length and decompose  into its dyadic component and a remainder:  ,  . The default maxscale  is then set with the following rules: DWT: (1) if  then  , otherwise (2) if expanding the series,  and (3) if contracting the series  . MODWT:  . |
filter=arg (default=“h”) | Wavelet filter class: “h” (Haar), “d” (Daubechies), “la” (least asymmetric). If “filter=h” or “filter=la”, the filter length may be specified using “flen=”. Wavelet filter boundary conditions are specified using the “bound=” option |
flen=integer | Wavelet filter excess length as an even number between 2 and 20. For use when “filter=d” (default= 4) or “filter=la” (default=8). |
bound=arg (default = “p”) | Filter boundary handling: “p” (periodic), “r” (reflective). |
Examples
dgp.wavethresh(maxscale=3)
The line above will perform wavelet thresholding on a series called DGP, using a soft threshold and the universal threshold limit. This procedure is also known as VisuShrink. It will do so up to the third wavelet scale and will use the MAD with a Gaussian correction for the measure of loss.
dgp.wavethresh(filter=d, flen=4, maxscale=1, threshtype=hard, threshlim=fdr)
The line above will perform wavelet thresholding using a Daubechies wavelet filter of length 4, up to the first wavelet scale. Furthermore, it will use a hard threshold and the false discovery rate limit with significance level 0.05.
Cross-references
Seasonally adjust series using the Census X11.2 method.
Earlier versions of EViews provided (historical) X11 routines as a separate procedure (see but the programs do not run on 64-bit operating systems and are no longer supported.
Syntax
series_name.x11(options) adj_name [fac_name]
Cross-references
Seasonally adjust series using the Census X12 method.
x12 is available only for quarterly and monthly series. The procedure requires at least 3 full years of data and can adjust up to 600 observations (50 years of monthly data or 150 years of quarterly data).
Syntax
series_name.x12(options) base_name
Enter the name of the original series followed by a dot, the keyword, and a base name (no more than the maximum length of a series name minus 4) for the saved series. If you do not provide a base name, the original series name will be used as a base name. See the description in “save=” option below for the naming convention used to save series.
Options
Commonly Used Options
mode=arg (default=“m”) | Seasonal adjustment method: “m” (multiplicative adjustment; Series must take only non-negative values), “a” (additive adjustment), “p” (pseudo-additive adjustment), “l” (log-additive seasonal adjustment; Series must take only positive values). |
filter=arg (default=“msr”) | Seasonal filter: “msr” (automatic, moving seasonality ratio), “x11” (X11 default), “stable” (stable), “s3x1” (3x1 moving average), “s3x3” (3x3 moving average), “s3x5” (3x5 moving average), “s3x9” (3x9 moving average), “s3x15” (3x15 moving average seasonal filter; Series must have at least 20 years of data). |
save= “arg” | Optionally saved series keyword enclosed in quotes. List the extension (given in Table 6-8, p.71 of the X12-ARIMA Reference Manual) for the series you want to save. The created series will use names of the form basename, followed by a series keyword specific suffix. Commonly used options and suffixes are: “"d10"” (final seasonal factors, saved with suffix “_sf”), “"d11"” (final seasonally adjusted series using “_sa”), “"d12"” (final trend-cycle component using “_tc”), “"d13"” (final irregular component using “_ir”). All other options are named using the option symbol. For example “save="d16"” will store a series named basename_d16. To save more than two series, separate the list with a space. For example, “save="d10 d12"” saves the seasonal factors and the trend-cycle series. |
tf=arg | Transformation for regARIMA: “logit” (Logit transformation), “auto” (automatically choose between no transformation and log transformation), number (Box-Cox power transformation using specified parameter; use “tf=0” for log transformation). |
sspan | Sliding spans stability analysis. Cannot be used along with the “h” option. |
history | Historical record of seasonal adjustment revisions. Cannot be used along with the “sspan” option. |
check | Check residuals of regARIMA. |
outlier | Outlier analysis of regARIMA. |
x11reg=arg | Regressors to model the irregular component in seasonal adjustment. Regressors must be chosen from the predefined list in Table 6-14, p. 88 of the X12-ARIMA Reference Manual. To specify more than one regressor, separate by a space within the double quotes. |
reg=arg_list | Regressors for the regARIMA model. Regressors must be chosen from the predefined list in Table 6-17, pp. 100-101 of the X12-ARIMA Reference Manual. To specify more than one regressor, separate by a space within the double quotes. |
arima=arg | ARIMA spec of the regARIMA model. Must follow the X12 ARIMA specification syntax. Cannot be used together with the “amdl=” option. |
amdl=f | Automatically choose the ARIMA spec. Use forecasts from the chosen model in seasonal adjustment. Cannot be used together with the “arima=” option and must be used together with the “mfile=” option. |
amdl=b | Automatically choose the ARIMA spec. Use forecasts and backcasts from the chosen model in seasonal adjustment. Cannot be used together with the “arima=” option and must be used together with the “mfile=” option. |
best | Sets the method option of the auto model spec to best (default is first). Also sets the identify option of the auto model spec to all (default is first). Must be used together with the “amdl=” option. |
modelsmpl=arg | Sets the subsample for fitting the ARIMA model. Either specify a sample object name or a sample range. The model sample must be a subsample of the current workfile sample and should not contain any breaks. |
mfile=arg | Specifies the file name (include the extension, if any) that contains a list of ARIMA specifications to choose from. Must be used together with the “amdl=” option. The default is the X12A.MDL file provided by the Census. |
outsmpl | Use out-of-sample forecasts for automatic model selection. Default is in-sample forecasts. Must be used together with the “amdl=” option. |
plotspectra | Save graph of spectra for differenced seasonally adjusted series and outlier modified irregular series. The saved graph will be named GR_seriesname_SP. |
prompt | Force the dialog to appear from within a program. |
p | Print X12 procedure results. |
Other Options
hma=integer | Specifies the Henderson moving average to estimate the final trend-cycle. The X12 default is automatically selected based on the data. To override this default, specify an odd integer between 1 and 101. |
sigl=arg | Specifies the lower sigma limit used to downweight extreme irregulars in the seasonal adjustment. The default is 1.5 and you can specify any positive real number. |
sigh=arg | Specifies the upper sigma limit used to downweight extreme irregulars in the seasonal adjustment. The default is 2.5 and you can specify any positive real number less than the lower sigma limit. |
ea | Nonparametric Easter holiday adjustment (x11easter). Cannot be used together with the “easter[w]” regressor in the “reg=” or “x11reg=” options. |
f | Appends forecasts up to one year to some optionally saved series. Forecasts are appended only to the following series specified in the “save=” option: “"b1"” (original series, adjusted for prior effects), “"d10"” (final seasonal factors), “"d16"” (combined seasonal and trading day factors). |
flead=integer | Specifies the number of periods to forecast (to be used in the seasonal adjustment procedure). The default is one year and you can specify an integer up to 60. |
fback=integer | Specifies the number of periods to backcast (to be used in the seasonal adjustment procedure). The default is 0 and you can specify an integer up to 60. No backcasts are produced for series more than 15 years long. |
aicx11 | Test (based on AIC) whether to retain the regressors specified in “x11reg=”. Must be used together with the “x11reg=” option. |
aicreg | Test (based on AIC) whether to retain the regressors specified in “reg=”. Must be used together with the “reg=” option. |
sfile=arg | Path/name (including extension, if any) of user provided specification file. The file must follow a specific format; see the discussion below. |
User provided spec file
EViews provides most of the basic options available in the X12 program. For users who need to access the full set of options, we have provided the ability to pass your own X12 specification file from EViews. The advantage of using this method (as opposed to running the X12 program in DOS) is that EViews will automatically handle the data in the input and output series.
To provide your own specification file, specify the path/name of your file using the “sfile=” option in the x12 proc. Your specification file should follow the format of an X12 specification file as described in the X12-ARIMA Reference Manual, with the following exceptions:
• the specification file should have neither a series spec nor a composite spec.
• the x11 spec must include a save option for D11 (the final seasonally adjusted series) in addition to any other extensions you want to store. EViews will always look for D11, and will error if it is not found.
• to read back data for a “save” option other than D11, you must include the “save=” option in the x12 proc. For example, to obtain the final trend-cycle series (D12) into EViews, you must have a “save=” option for D12 (and D11) in the x11 spec of your specification file and a “save=d12" option in the EViews x12 proc.
Note that when you use an “sfile=” option, EViews will ignore any other options in the x12 proc, except for the “save=” option.
Difference between the dialog and command line
The options corresponding to the Trading Day/Holiday and Outliers tab in the X12 dialog should be specified by listing the appropriate regressors in the “x11reg=” and “reg=” options.
Examples
The command:
sales.x12(mode=m,save="d10 d12") salesx12
seasonally adjusts the SALES series in multiplicative mode. The seasonal factors (d10) are stored as SALESX12_SF and the trend-cycles series is stored as SALESX12_TC.
sales.x12(tf=0,arima="(0 0 1)",reg="const td")
specifies a regARIMA model with a constant, trading day effect variables, and MA(1) using a log transformation. This command does not store any series.
freeze(x12out) sales.x12(tf=auto, amdl=f, mfile= "c:\eviews\mymdl.txt")
stores the output from X12 in a text object named X12OUT. The options specify an automatic transformation and an automatic model selection from the file “Mymdl.TXT”.
revenue.x12(tf=auto,sfile="c:\eviews\spec1.txt",save="d12 d13")
adjusts the series REVENUE using the options given in the “Spec1.TXT” file. Note the following: (1) the “tf=auto” option will be ignored (you should instead specify this option in your specification file) and (2) EViews will save two series REVENUE_TC and REVENUE_IR which will be filled with NAs unless you provided the “save=” option for D12 and D13 in your specification file.
freeze(x12out) sales.x12(tf=auto, amdl=f, mfile= "c:\eviews\mymdl.txt")
stores the output from X12 in the text object X12OUT. The options specify an automatic transformation and an automatic model selection from the file “Mymdl.TXT”. The seasonally adjusted series is stored as SALES_SA by default.
revenue.x12(tf=auto,sfile="c:\eviews\spec1.txt",save="d12 d13")
adjusts the series REVENUE using the options given in the “Spec1.TXT” file. Note the following: (1) the “tf=auto” option will again be ignored (you should instead specify this in your specification file) and (2) EViews will error if you did not specify a “save=” option for D11, D12, and D13 in your specification file.
Cross-references
See
“Census X12” for a discussion of the Census X12 program. The documentation for X12,
X12-ARIMA Reference Manual, may be found in the “docs” subdirectory of your EViews directory, in the PDF files “Finalpt1.PDF
” and “Finalpt2.PDF
”.
Seasonally adjust series using the Census X-13 method.
Census X-13 is available only for quarterly and monthly series. The procedure requires at least 3 full years of data and can adjust up to 600 observations (50 years of monthly data or 150 years of quarterly data).
Syntax:
series.x13(options) [@reg(regopts)] [@arima(arimaopts)] [@x11arima(x11arimaopts)] [@tramo(tramopts)] [@x11(x11opts)] [@seats(seatsopts)]
You should follow the x13 keyword with general options and optionally, specifications for regression (@reg), ARIMA (either manual (@arima), X-11 automatic (@x11arima), or TRAMO automatic (@tramo)), and seasonal adjustment (either X-11 based (@x11) or SEATS based (@seats)) components.
When using X-13, EViews calls the X-13 executable written by the US Census. Many of the options available in the EViews x13 command closely mirror those available in the original X-13 executable. As such in the documentation of options that follows, we often make reference to the original Census documentation, which is included in PDF form with the rest of your EViews documentation.
You should note that while EViews does not offer direct support for the full set of Census X‑13, most of the specification statements allow you to directly add Census X-13 options using the extra option. For example, although EViews does not directly support the “constant” or “adjust” options of the X-13 Transformation spec (see Section 7.18 of the Census X-13 documentation), you may instruct Census X-13 to use those options by adding the option
tfextra=”constant adjust”
to your EViews X-13 command.
Specification Component Options
The regression, manual, X-11 or TRAMO automatic ARIMA, and X11 or SEATS based seasonal adjustment specification components,
[@reg(regopts)] [@arima(arimaopts)] [@x11arima(x11arimaopts)] [@tramo(tramopts)] [@x11(x11opts)] [@seats(seatsopts)]
each take various options. In this section, we outline the possible settings for each of these components.
Regression Specification (@reg)
Include exogenous variables in the ARIMA regression. If @arima, @x11arima, and @tramo specs are not included, a simple regression without ARIMA is performed. See Section 7.13 of the Census X-13 documentation for details.
| | X-13 Equivalent Option |
regs=list | Quoted, space delimited, list of X-13 built-in variables to use as regressors. For a full list of available variable types, see Table 7.27 of the X-13 documentation. | Variables= |
userregs=list | Quoted, space delimited, list of series to include as user-variables in the regression. Each member of the list should be a valid series expression (e.g. “X” or “log(X)”). | User= |
usertypes=list | Quoted, space delimited, list of user variable types. The number of elements in the list must be the same as the number of elements in the “userregs” list, or should contain only one type, which will apply to all variables listed in “userregs”. Types can be “constant” (constant), “seasonal” (seasonal), “td” (trading-day), “tdstock” (trading-day stock), “lom” (length of month), “loq” (length of quarter), “lpyear” (leap year), “easter” (Easter), “thanks” (Thanks-giving), “labor” (Labor day), “ao”, “ls”, “rp”, “so” or “tc” (outlier effects), “transitory” (SEATS transitory), “holiday1”, “holiday2”, “holiday3”, “holiday4” or “holiday5” (user-defined holidays), or “user” (none of the above). | Usertype= |
aictest=list | Quoted, space delimited, list of variables to include in the AIC based variable selection routine. Only certain variable types may be included in this list: “td”, “tdnolpyear”, “tdstock”, “td1coef”, “td1nolpyear”, “tdstock1coef”, “lom”, “loq”, “lpyear”, “easter”, “easterstock”, and “user”. See Table 7.27 of the X-13 documentation for a description of these variables. | AICtest= |
chitest | Perform a chi-squared test for inclusion of all user-defined holiday variables. | Chi2test=yes |
regextra=list | A quoted, space delimited, list of any extra regression options included as part of X-13. | |
Manual ARIMA (@arima)
The @arima spec allows you to specify manually an ARIMA model to be used. Note that an @arima spec cannot be used at the same time as an @x11arima or @tramo spec. See Section 7.1 of the X-13 documentation for details.
| | X-13 Equivalent Option |
model=text | Set the ARIMA model by specifying the model in standard “(p,d,q)(P,D,Q)” format. The text argument must be surrounded by quotes. See the Census X-13 documentation for details on the syntax of text. | Model= |
ar=list | Set the starting values for the AR parameters in the ARIMA model. list should be a quoted, comma separated list of AR parameters. A blank space between commas may be used to use the default starting value for a parameter. To fix a parameter at its starting value, you may append the “f” character to the end of the parameter value (e.g., to fix a parameter at 0.7, use “0.7f”) | AR= |
ma=list | Set the starting values for the MA parameters in the ARIMA model. list should be a quoted, comma separated list of MA parameters. A blank space between commas may be used to use a default starting value for a parameter. To fix a parameter at its starting value, you may append the “f” character to the end of the parameter value (e.g., to fix a parameter at 0.7, use “0.7f”) | MA= |
Automatic ARIMA Selection using X-11 (@x11arima)
Use X-11-ARIMA to automatically choose an ARIMA model. Note that an @x11arima spec cannot be used at the same time as an @arima or @tramo spec. See Section 7.12 of the Census X-13 documentation for more details.
| | X-13 Equivalent Option |
mfile=file | Specify a file on disk containing the list of possible ARIMA models to choose from. Note that this option cannot be used with the “max*” options. See the Details portion of Section 7.12 of the Census X-13 documentation for details on how to create a valid ARIMA model file. | File= |
maxar= integer | Set the maximum number of AR terms in models to be selected from. Cannot be used with the “mfile=” option. | |
maxdiff= integer | Set the maximum differencing order in models to be selected from. Cannot be used with the “mfile=” option. | |
maxma= integer | Set the maximum number of MA in models to be selected from. Cannot be used with the “mfile=” option. | |
maxsar= integer | Set the maximum number of seasonal AR terms in models to be selected from. Cannot be used with the “mfile=” option. | |
maxsdiff= integer | Set the maximum seasonal differencing order in models to be selected from. Cannot be used with the “mfile=” option. | |
maxsma=integer | Set the maximum number of seasonal MA in models to be selected from. Cannot be used with the “mfile=” option. | |
amdl=F | Use only forecasts from the ARIMA model in model evaluation. Without this option, both forecasts and backcasts are used. | Mode=f |
outsmpl | Use out of sample forecast errors during model evaluation | Outofsample=yes |
best | Model selection tests all possible models and chooses the most likely. Without this option, the model selection routine will chose the first model that matches model selection criteria. | Method=best |
flim= number | Sets the acceptance threshold for the within-sample forecast error test. | Fcstlim= |
blim= number | Sets the acceptance threshold for the within-sample backcast error test. Only applies if the amdl=f option is not set. | Bcstlim= |
x11aimaextra=list | A quoted, space delimited, list of any extra X-11 automatic ARIMA options included as part of X-13. | |
Automatic ARIMA selection using TRAMO (@tramo)
Use TRAMO to automatically choose an ARIMA model. Note that an @tramo spec cannot be used at the same time as an @arima or @x11arima spec. See Section 7.2 of the Census X-13 documentation for more details.
| | X-13 Equivalent Option |
maxorder= “(int1, int2)” | Set the maximum order of AR, MA, SAR and SMA terms in candidate models. int1 sets the maximum for AR and MA terms, and int2 sets the maximum for seasonal AR and seasonal MA terms. | Maxorder= |
maxdiff = “(int1, int2)” | Sets the maximum differencing and seasonal differencing in candidate models. int1 sets the maximum differencing, and int2 sets the maximum seasonal differencing. Note the “maxdiff” option cannot be used along with the “diff” option. | Maxdiff= |
diff = “(int1, int2)” | Set a fixed differencing for candidate models – i.e. differencing will not be automatically chosen. int1 sets differencing, and int2 sets seasonal differencing. Note that the “diff” option cannot be used along with the “maxdiff” option. | Diff= |
nomixed | Do not allow mixed (i.e. models with both AR and MA terms) amongst the candidate models. | Mixed=no |
rejectfcst | Test the out-of-sample forecast error of the final three years of data with the identified model to determine if forecast extension should be applied. | Rejectfcst=yes |
flim=number | Sets the acceptance threshold for the within-sample forecast error test of the final identified model. Only applies if the “rejectfcst” option is set. | Fcstlim= |
lbqlim=number | Acceptance criterion for confidence coefficient of the Ljung-Box Q statistic. | Ljungboxlimit= |
acceptdef | Controls whether the default model is chosen if the Ljung-Box Q statistic for its model residuals is acceptable. | Acceptdefault =yes |
nomu | Do not check for significance of the constant term in candidate models | Checkmu=no |
tramoextra=list | A quoted, space delimited, list of any extra TRAMO automatic ARIMA options included as part of X-13. | |
X-11 Seasonal Adjustment (@x11)
Perform an X-11 based seasonal adjustment. Note that an @x11 spec cannot be included at the same time as an @seats spec. See Section 7.19 of the Census X-13 documentation for details.
| | X-13 Equivalent Option |
mode=arg | Sets the mode of seasonal adjustment decomposition: “mult” (multiplicative), “add” (additive), “pseudoadd” (pseudo-additive), or “logadd” (log-additive). The default is “mult”. | Mode= |
type=arg | Sets the type of seasonal adjustment: “sum” (summary), “trend”, or “sa” (default). See the Census X-13 documentation for a full description of each. | Type= |
filter=arg | Specifies the seasonal moving average filter to use: “s3x1” (3x1 moving average), “s3x3”, (3x3 moving average), “s3x5” (3x5 moving average), “s3x9” (3x9 moving average), “s3x15” (3x15 moving average), “stable” (Stable seasonal filter), “x11default” (3x3 followed by a 3x5), or “msr” (default). You can set a different filter for each MA term by entering multiple values for key, separated by commas and surrounded in quotes (e.g., filter=”s3x1, s3x3, s3x9”). | Seasonalma= |
fcast | Append forecasted values to certain output series. See the Census X-13 documentation for a list of available series. This option must be used with the “flen=” general option. | appendfcst |
bcast | Pre-pend backcasted values to certain output series. See the Census X-13 documentation for a list of available series. This option must be used with the “blen=” general option. | appendbcst |
trendma= integer | Length of the Henderson moving average to use. integer may be any odd integer between 1 and 101. | Trendma= |
x11extra=list | A quoted, space delimited, list of any extra X-11 seasonal adjustment options included as part of X-13. | |
SEATS Seasonal Adjustment (@seats spec)
Perform a SEATS based seasonal adjustment. Note that an @seats spec cannot be included at the same time as an @x11 spec. See Section 7.14 of the Census X-13 documentation for more details.
| | X-13 Equivalent Option |
fcast | Append forecasted values to certain output series. See the Census X-13 documentation for a list of available series. This option must be used with the “flen=” general option. | appendfcst |
bcast | Prepend backcasted values to certain output series. See the Census X-13 documentation for a list of available series. This option must be used with the “blen=” general option. | appendbcst |
hp | Decompose the trend-cycle component into a long-term component using the Hodrick-Prescott filter. | Hpcycle=yes |
nostat | Do not accept any stationary seasonal ARIMA models, and convert the seasonal part to (0, 1, 1). | Statseas=no |
qmax=integer | Sets a limit for the Ljung-Box Q statistic, which is used to determine if the model provided to SEATS is of acceptable quality. | Qmax= |
seatsextra=list | A quoted, space delimited, list of any extra SEATS seasonal adjustment options included as part of X-13. | |
Force Annual Totals (@force spec)
Force the annual totals of the adjusted series to match those of the original series. See Section 7.6 of the Census X-13 documentation for additional details.
| | X-13 Equivalent Option |
type=arg | Change the forcing algorithm. Arg can be "denton" or "regress." Default is "denton." | type |
mode=arg | Change the mode of the algorithm. Arg can be "ratio" or "diff." Default is "ratio." | mode |
target=arg | Specify the target for matching the annual totals. Arg can be "cal" (Calendar Adjusted Series), "perm" (Original series adjusted for permanent prior adjustment factors), or "both." If this option is not used, the original series is used as the target. | target |
round | Use rounded data for matching. | round |
rho=val | Specify the value for rho. | rho |
lambda=val | Specify the value for lambda. | lambda |
Options
General Options
savespec=name | Save a copy of the X-13 spec file as a text object in the workfile. This can be useful as a template when making your own spec file to use with the “spec=” option. |
save = list | Output series to save from the seasonal adjustment routine. list should be space delimited, in quotes, and contain the list of small identifiers from Table 7.46 (if doing X-11) or Table 7.30 (if doing SEATS) of the Census X-13 documentation. If this option is omitted, EViews will save the seasonally adjusted series (D11 for X-11, and S11 for SEATS). |
errlog=name | Save a copy of the error log as a text object in the workfile. The error log will only be saved if the X-13 executable created an error message. |
spec=name | User supplied X-13 spec file. Either a file on disk, or a text object in the workfile. Note that this option overrides all other options apart from “prompt”, “save”, “savespec” and “errlog”. Note you can use the “savespec” option to generate a spec file for editing. If your spec file contains a SERIES specification, EViews will use it. If it does not, EViews will generate one. In general we recommend letting EViews generate the SERIES part of your spec file. |
html | Generate html formatted output. If not specified, text formatted output is the default. |
prompt | Force dialog to show in program |
p | Print output from the procedure. |
Transformation Options:
Sets options for the transformation of data used. See the Transformation section, 7.18, of the Census X-13 documentation for more details.
tf=arg | Employ data transformation: “logit” (logistic), “auto” (choose between log or none), “log” (natural log), or number (where number is a Box-Cox power parameter. for the Box-Cox transformation). |
tfextra=list | A quoted, space delimited, list of any extra transformation options included as part of X-13. The full set of possible options is provided in Section 7.18 of the X-13 documentation. |
Automatic Outlier Options
Sets options for automatic outlier detection. Note that specific outliers can be included in the optional @reg spec. See the Outlier section, 7.11, of the Census X-13 documentation for more details.
| | X-13 Equivalent Option |
outcrit=arg | Value to which the absolute values of the outlier t-statistics are compared to detect outliers in automatic outlier detection. | Critical= |
outls=arg | Compute t-statistics to test the null hypotheses that each run of 2,..., outls successive level shifts cancel to form a temporary level shift. | Lsrun= |
outall | Sets the outlier detection method to all at once (as opposed to one at a time). | Method=addall |
outtype=list | List of types of outliers to include in outlier detection (quoted and space delimited). Members of the list can include “ao” (additive outlier), “ls” (level shift), “tc” (temporary change), “so” (seasonal outliers). You may use the special unquoted keyword “all” to include all types, as in “outtype=all”. | Types= |
outspan=arg | Set the dates to search between. arg should be two dates, surrounded in quotes, of the format “YYYY.MON YYYY.MON” (for monthly data) or “YYYY.Q YYYY.Q” (for quarterly), where MON is a three letter month abbreviation, and Q is an integer representing the quarter. | Span= |
outextra=list | A quoted, space delimited, list of any extra outlier options included as part of X-13. | |
Estimation Options
Sets estimation options for the ARIMA/Regression estimation. Only relevant if a @reg, @arima, @x11arima, or a @tramo spec are included. See the Estimation section, 7.5, of the Census X-13 documentation for more details.
| | X-13 Equivalent Option |
tol=number | Set the convergence tolerance | Tol= |
iter=integer | Set the maximum number of iterations | Maxiter= |
exact=arg | Specifies the use of an exact or a conditional likelihood for estimation:. “arma” (use exact likelihood for both AR and MA terms), “ma” (use conditional likelihood for AR and exact likelihood for MA terms), and “none” (use conditional likelihood for both sets of terms). | Exact= |
arimasmpl=arg | Set the estimation sample. arg should be two dates, surrounded in quotes, of the format “YYYY.MON YYYY.MON” (for monthly data) or “YYYY.Q YYYY.Q” (for quarterly), where MON is a three letter month abbreviation, and Q is an integer representing the quarter. | Modelspan= (in the SERIES spec, section 7.15). |
estextra=list | A quoted, space delimited, list of any extra estimation options included as part of X-13. | |
Forecast Options
Sets forecast options for the ARIMA/Regression estimation. Only relevant if a @reg, @arima, @x11arima, or a @tramo spec are included. See the Forecast section, 7.7, of the Census X-13 documentation for more details.
| | X-13 Equivalent Option |
flen=integer | Length of forecast to perform. May be between 0 and 60. Note that if performing SEATS seasonal adjustment, the forecast length will be adjusted upwards to 2 years (24 months or 8 quarters). | Maxlead= |
blen=integer | Length of backcast to perform. May be between 0 and 60. | Maxback= |
forclognorm | Adjust forecasts to reflect that forecasts are generated from a log-normal distribution. | Lognormal |
forcextra=list | A quoted, space delimited, list of any extra forecast options included as part of X-13. | |
Examples
As an example of using X-13, we will seasonally adjust some data obtained from FRED. The workfile, “X13 Macro.wf1” contains monthly non-seasonally adjusted US unemployment data from January 2005 to June 2012 in a series called UNRATENSA.
The command:
unratensa.x13(save="d12 d10 d13 d11") @x11arima @x11
performs X-11 based seasonal adjustment using X-11-ARIMA to automatically select the ARIMA model, using the default set of candidate models. We save the final seasonally adjusted series (D11), the final trend series (D12), the final seasonal factors (D10), and the irregular component (D13) as series in the workfile.
The command:
unratensa.x13(save="s12s10s13s11 afd", outtype="all", flen=24) @tramo(maxdiff="(2,1)", maxorder="(2,1)") @seats(fcast, seatsextra="signifsc=0.5")
Performs SEATS based seasonal adjustment, where TRAMO is used to automatically detect the best ARIMA model (with a maximum AR and MA order of 2, a maximum SAR and SMA order of 1, maximum differencing of 2, and a maximum seasonal differencing of 1), automatic outlier detection is included, with all types of outliers detected, and 24 periods of forecasted values are kept. Note that we use the seatsextra option to specify the non-included signifsc SEATS option. We save the final seasonally adjusted series (s11), the final trend series (s12), the final seasonal factors (s10), the irregular component (s13), and the forecasted seasonally adjusted values (afd) as series in the workfile.
Examples
See
“Census X-13” for a discussion of the Census X-13 program. The full documentation for the Census program,
X-13ARIMA-SEATS Reference Manual, can be found in the “docs” subdirectory of your EViews installation directory in the PDF file “X-13 Reference Manual.pdf”.